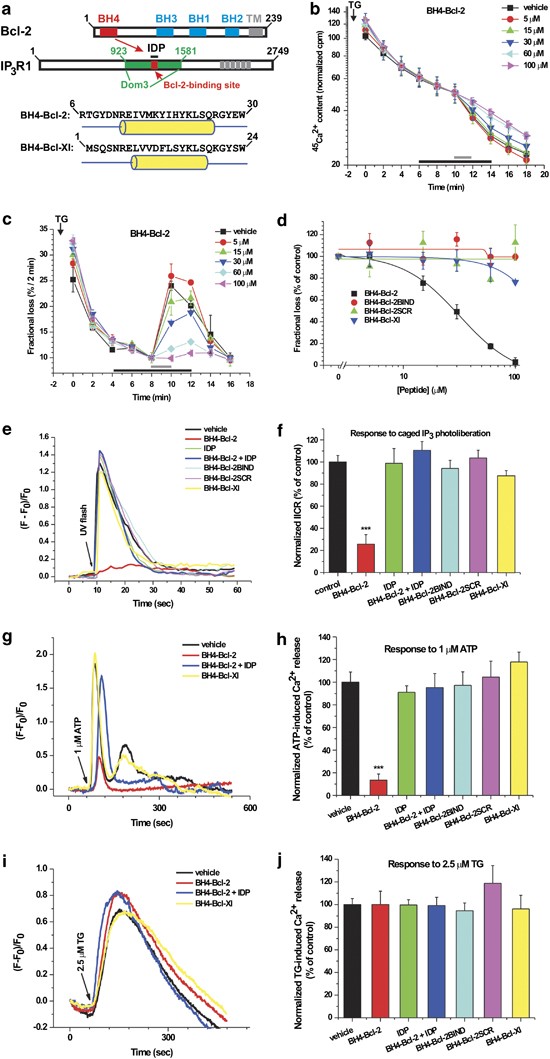
Figure 1

Although the BH4 domains of Bcl-2 and Bcl-Xl are similar in sequence and structure, they differentially regulate IP3R-mediated Ca2+ flux in permeabilized and intact cells. (a) Schematic presentation of the antiapoptotic Bcl-2-family members and the IP3R. The N-terminal BH4 domain is unique for antiapoptotic members. The secondary structure and primary sequence of BH4-Bcl-2 and BH4-Bcl-Xl are very similar. The cylindrical tube represents the predicted α-helical structure (PSIPREDv2.7). The central modulatory domain of the IP3R1, containing the Bcl-2-binding site (a.a. 1389–1408), is depicted (Dom3=a.a. 923–1581). A peptide corresponding to a.a. 1389–1408 (IDP) could prevent binding of Bcl-2 to IP3Rs. (b) Unidirectional 45Ca2+ fluxes in permeabilized MEF cells plotted as 45Ca2+ content (counts per min (c.p.m.)) as a function of time (min). Ca2+ release was activated by 3 μM IP3 (gray bar) in the absence or presence of the different BH4-domain peptides (black bar). A typical experiment is shown. (c) Same experiment as in (b), but results are plotted as fractional loss (%/2 min) as a function of time. (d) IICR was quantified as the fractional loss after 2 min of IP3 incubation minus the fractional loss before the IP3 addition. IICR in the presence of vehicle was set as 100% and other values were normalized to this value. A dose-response curve is shown for BH4-Bcl-2, a non-binding mutant of BH4-Bcl-2 (BH4-Bcl-2BIND), BH4-Bcl-2 SCR and BH4-Bcl-Xl, obtained from three to four independent experiments. Data points represent mean±S.E.M. (e) Intracellular Ca2+ signals in intact C6 glioma cells were monitored using Fluo-3. Cells were loaded with caged IP3 (50 μM) and electroporated with different BH4-domain peptides (20 μM) and/or IDP. IP3 was released by a UV flash and a rapid increase in cytosolic [Ca2+] was observed. (f) Quantitative analysis of the area under the curve in (e) was obtained from at least six independent experiments and data are plotted as mean±S.E.M. These data indicate that BH4-Bcl-2 significantly inhibited IICR, whereas the other BH4-domain peptides did not. IDP (20 μM) prevented the inhibition of IICR by BH4-Bcl-2. (g) A typical experiment in Fluo-3-loaded C6 glioma cells loaded with 20 μM of different BH4-domain peptides or IDP depicting Ca2+ signals in response to ATP (1 μM). For clarity reasons, Ca2+ responses in cells loaded with vehicle, BH4-Bcl-2, BH4-Bcl-2 + IDP or BH4-Bcl-Xl are shown. (h) Quantitative analysis of the area under the curve of the ATP-induced Ca2+ signals in intact Fluo-3-loaded C6 glioma cells loaded with the different BH4-domain peptides (20 μM) in response to 1 μM ATP (5-9 independent experiments). (i) Similar experiment as (g) except that cells were pretreated with EGTA (1 mM) 1 min before exposure to thapsigargin (TG; 2.5 μM). (j) Quantitative analysis of the area under the curve of the TG-induced Ca2+ responses (five independent experiments)
