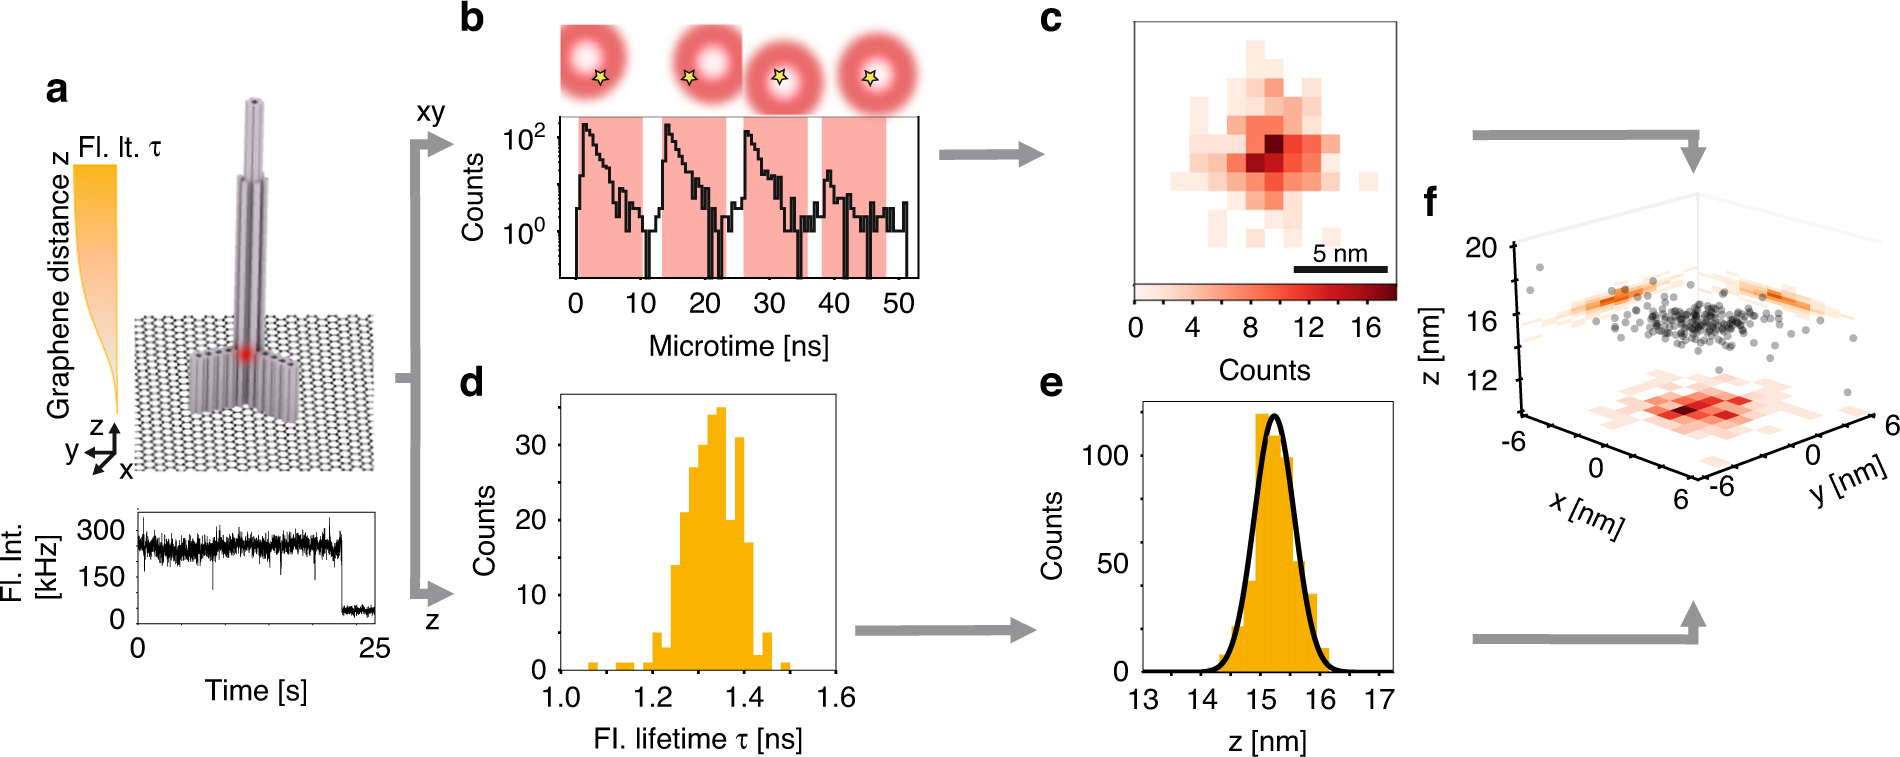
Fig. 1: Combining pMINFLUX with graphene energy transfer for precise 3D localizations.

a Top: Schematic of a DNA origami structure with a single dye positioned at a height of 16 nm above a graphene-on-glass coverslip. Bottom: Fluorescence intensity trace of the total fluorescence intensity of a single dye molecule in a single DNA origami structure. b Fluorescence decays for each of the four pulsed interleaved vortex-shaped beams which are focused on the sample arranged in a triangular pattern with the fourth beam placed at the center of the triangular structure. The star indicates the xy position of the dye molecule. c xy localization histogram of time bins. d Distribution of fluorescence lifetimes obtained from the time bins. e Distribution of the distances to graphene z calculated from the fluorescence lifetimes of d). f 3D localizations of the full fluorescence intensity trace using the 2D information of pMINFLUX and the z distances from the fluorescence lifetimes. The individual localizations are shown in black and on the sides the corresponding projections with a binning of 1 nm for xy and 0.2 nm for z
