
Fig. 1: Geographic origin of populations and phenotypic diversity of Zymoseptoria tritici.
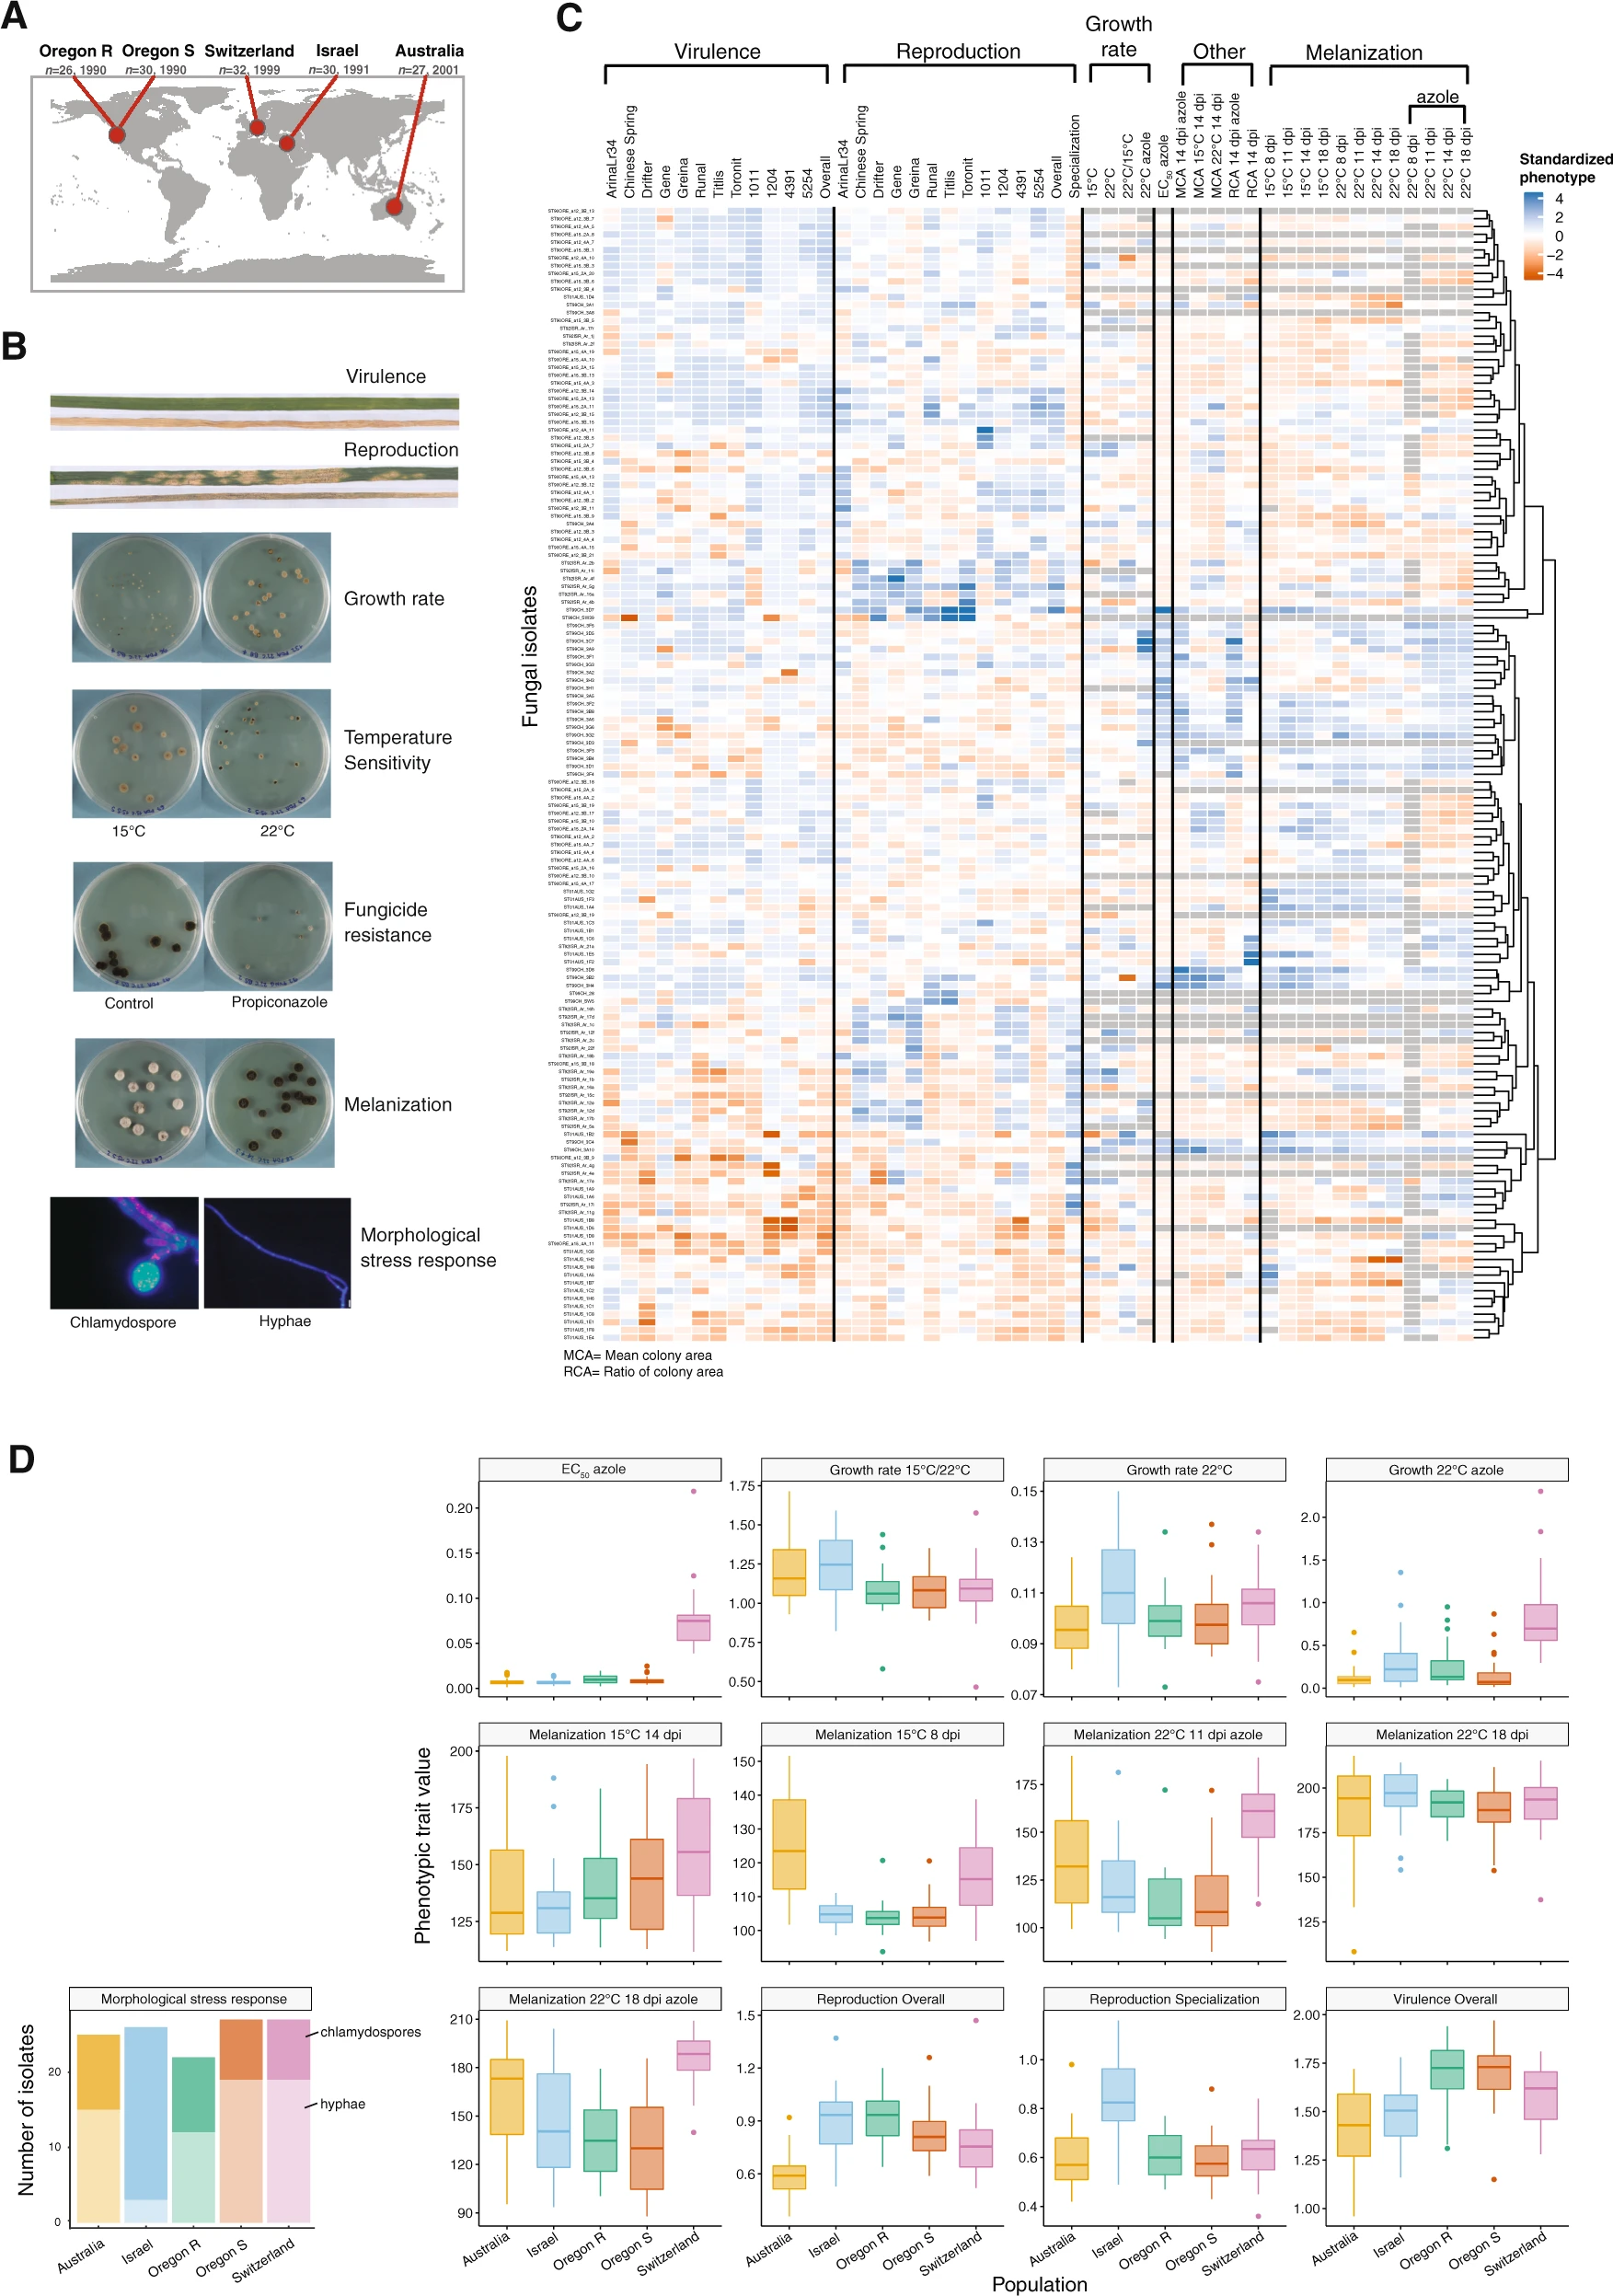
A World map showing the field locations of the five pathogen populations (n = 145 isolates). The two populations in Oregon (USA) were sampled from wheat cultivars Madsen (resistant; Oregon.R) and Stephens (susceptible; Oregon.S). B Major categories of life-history traits observed in Z. tritici on the host and in the non-host environments (virulence – amount of necrotic lesion on the leaf; reproduction – pycnidia formation within lesions). C Heatmap showing phenotypic diversity of 49 traits using standardized phenotypic trait values. Pathogen virulence was assessed by the percentage of necrotic lesions on wheat leaves. Reproduction specialization was defined by the adjusted coefficient of variation of means across all 12 wheat hosts. Melanization was expressed on a grayscale ranging from 0 (white) to 255 (black). Dendrogram branches correspond to Euclidean distances for phenotypic trait values. D Phenotypic trait distribution in different environments among the five populations. The binary morphological stress response trait is shown separately.
