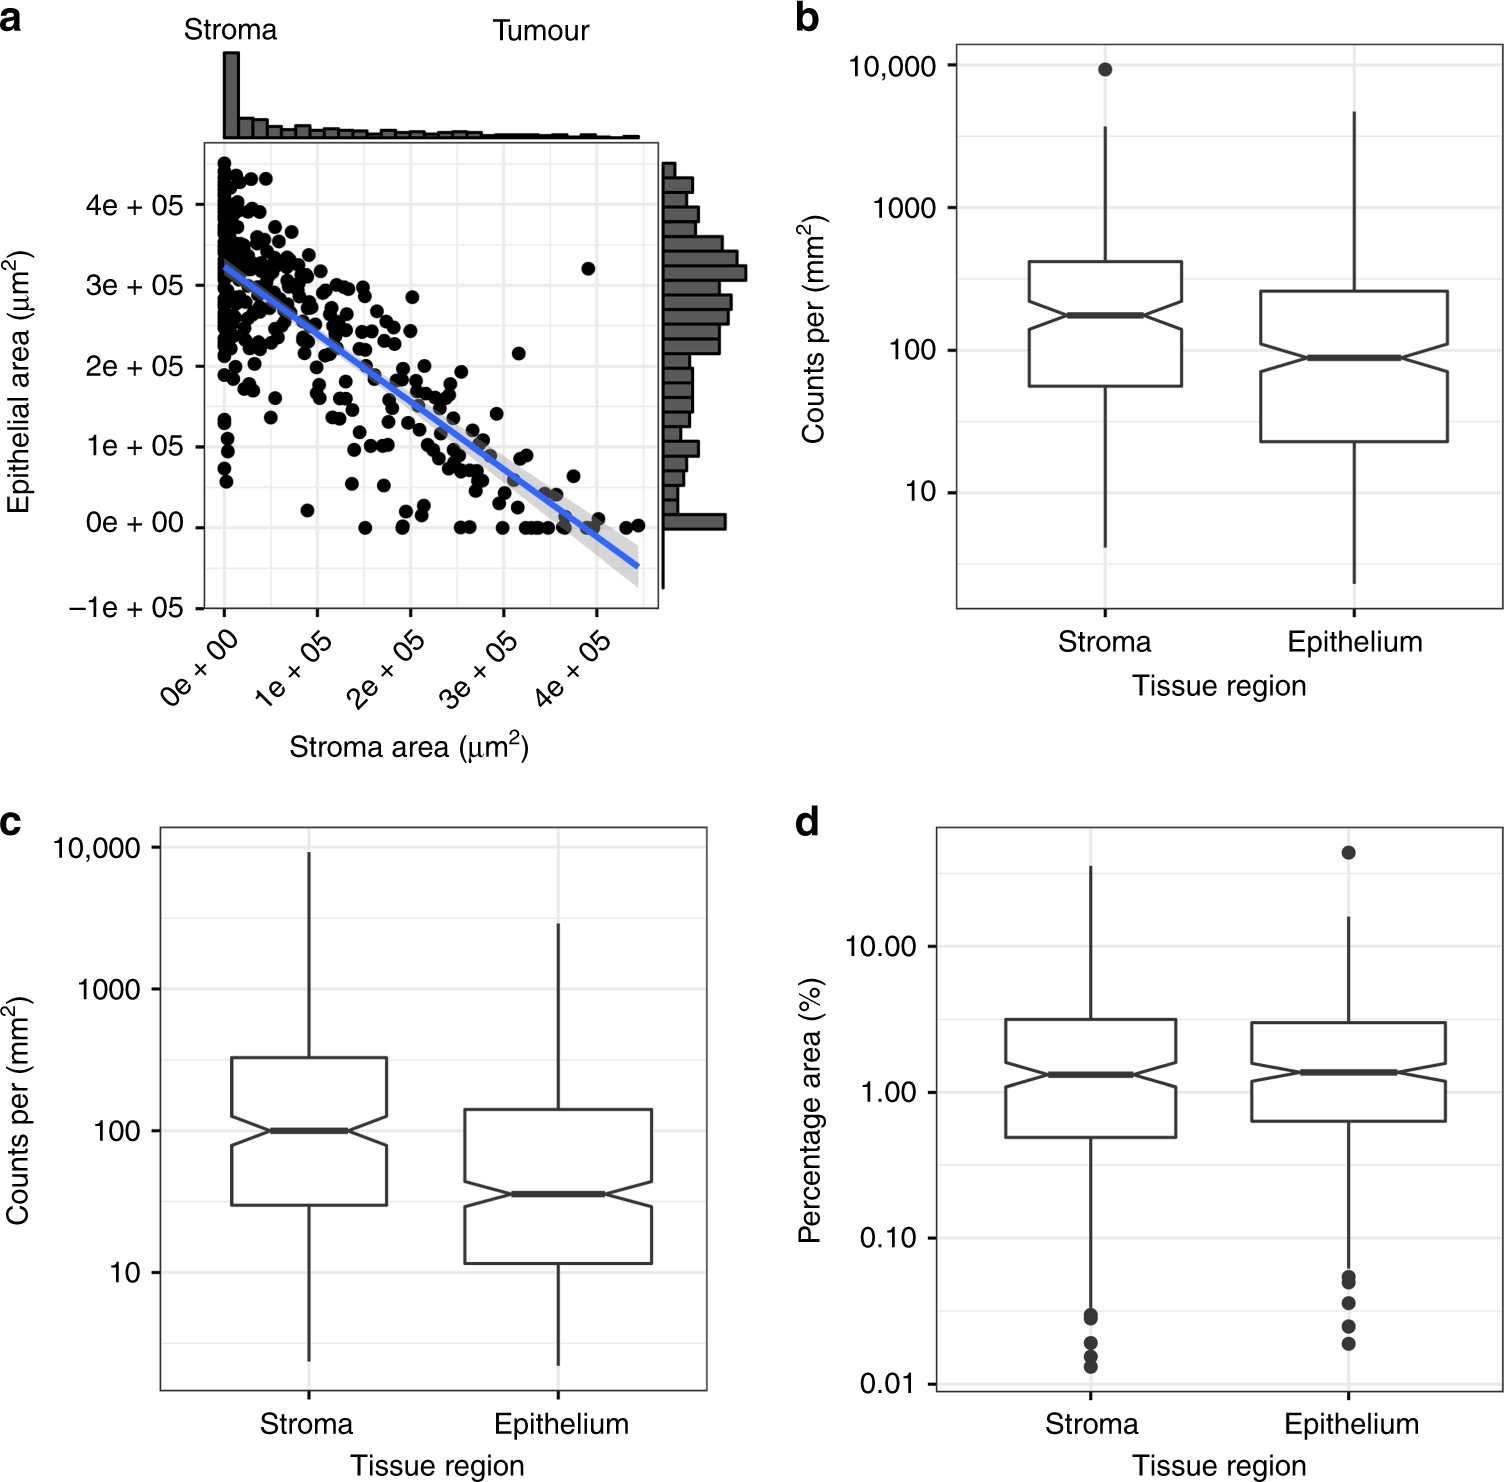
Fig. 1: Proportions of immune cells vary between epithelial and stroma areas of tumours.

a Scatter plot of the average stroma and epithelial tumour areas for each patient. b–d show respectively the distribution of densities of CD8+, CD45RO+ and CD68+ cell in epithelium and stroma. CD8+ and CD45RO+ densities were defined as counts per mm2 and CD68+ as the percentage of tissue stained for this marker. Notches on box plots extend 1.58 × IQR/sqrt(n) and approximate the 95% confidence interval for the median. Box plot whiskers extend to 1.5 × IQR.
