Fig. 1
From: A viral-fusion-peptide-like molecular switch drives membrane insertion of botulinum neurotoxin A1

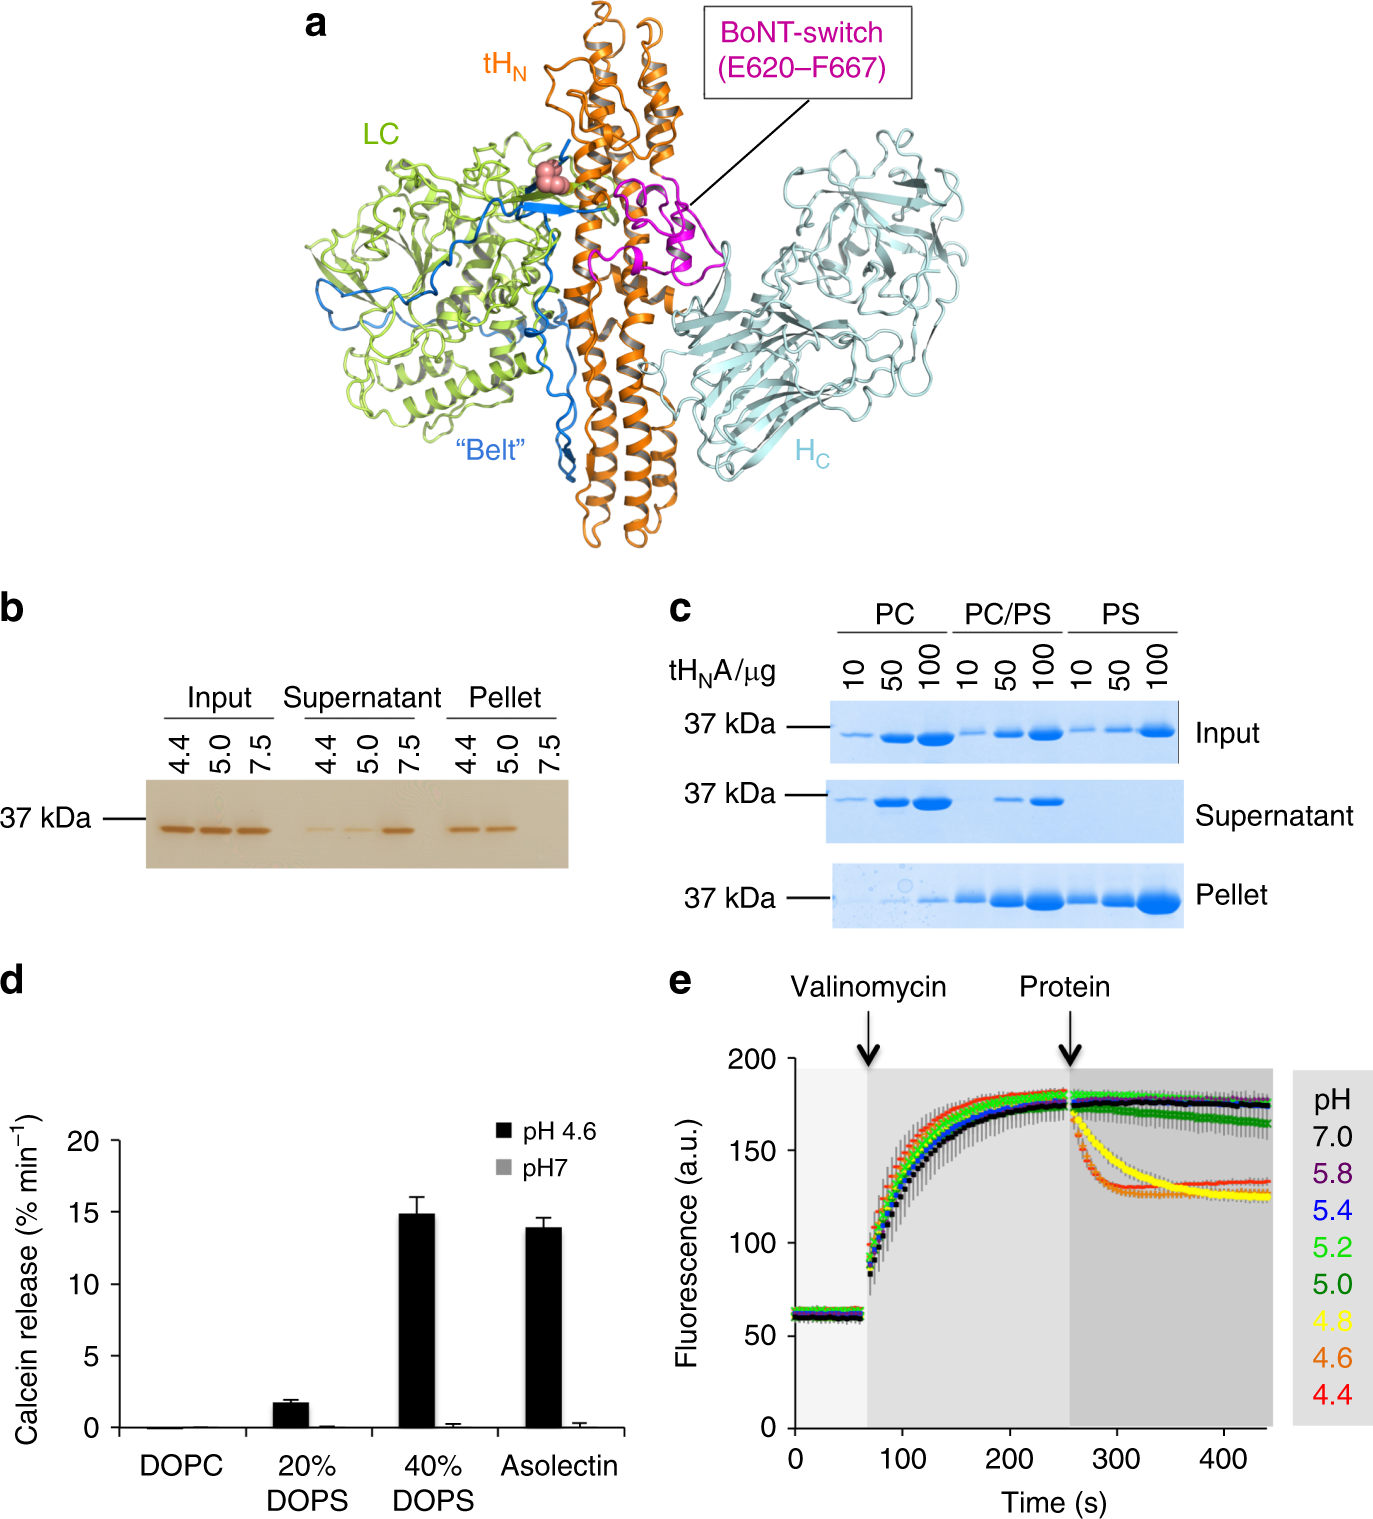
Biochemical characterization of tHNA. a The structure of BoNT/A1 (PDB code 3BTA). LC, the “belt”, tHN, and HC are colored green, marine, orange, and cyan, respectively. The disulfide linkage between LC and HN is shown as salmon sphere and the BoNT-switch is highlighted in magenta. b, c Co-sedimentation of tHNA with liposomes. tHNA was incubated with asolectin liposomes at pH 7.5, 5.0 or 4.4 (b); or incubated with liposomes containing 60/40 mol% PC/cholesterol, 30/30/40 mol% PC/PS/cholesterol, or 60/40 mol% PS/cholesterol at pH 4.4 (c). After liposomes were pelleted, the proteins in input, supernatant, and pellet fractions were analyzed by SDS-PAGE. These experiments were performed in triplicate and quantification of protein band intensities are shown in Supplementary Fig. 11. Uncropped images of gels are shown in Supplementary Fig. 13. d Calcein dye release assay. tHNA was tested with four different liposomes loaded with 50 mM calcein at pH 4.6 or pH 7.0, whereas liposomes were composed of DOPC alone, 80/20 mol% DOPC/DOPS, 60/40 mol% DOPC/DOPS, or asolectin. The rate of calcein dye release was determined based on the increase of fluorescence at 525 nm during excitation at 493 nm. Error bars indicate SD of triplicate measurements. e Membrane depolarization assay. Liposomes composed of 70/20/10 mol% DOPC/DOPS/cholesterol were polarized at a positive internal voltage by adding valinomycin in the presence of a transmembrane KCl gradient. Membrane potential was measured using the voltage-sensitive fluorescence dye ANS. After 3 min, tHNA was added at the indicated buffer pH. The data are presented as mean ± S.D., n = 3
