Fig. 1

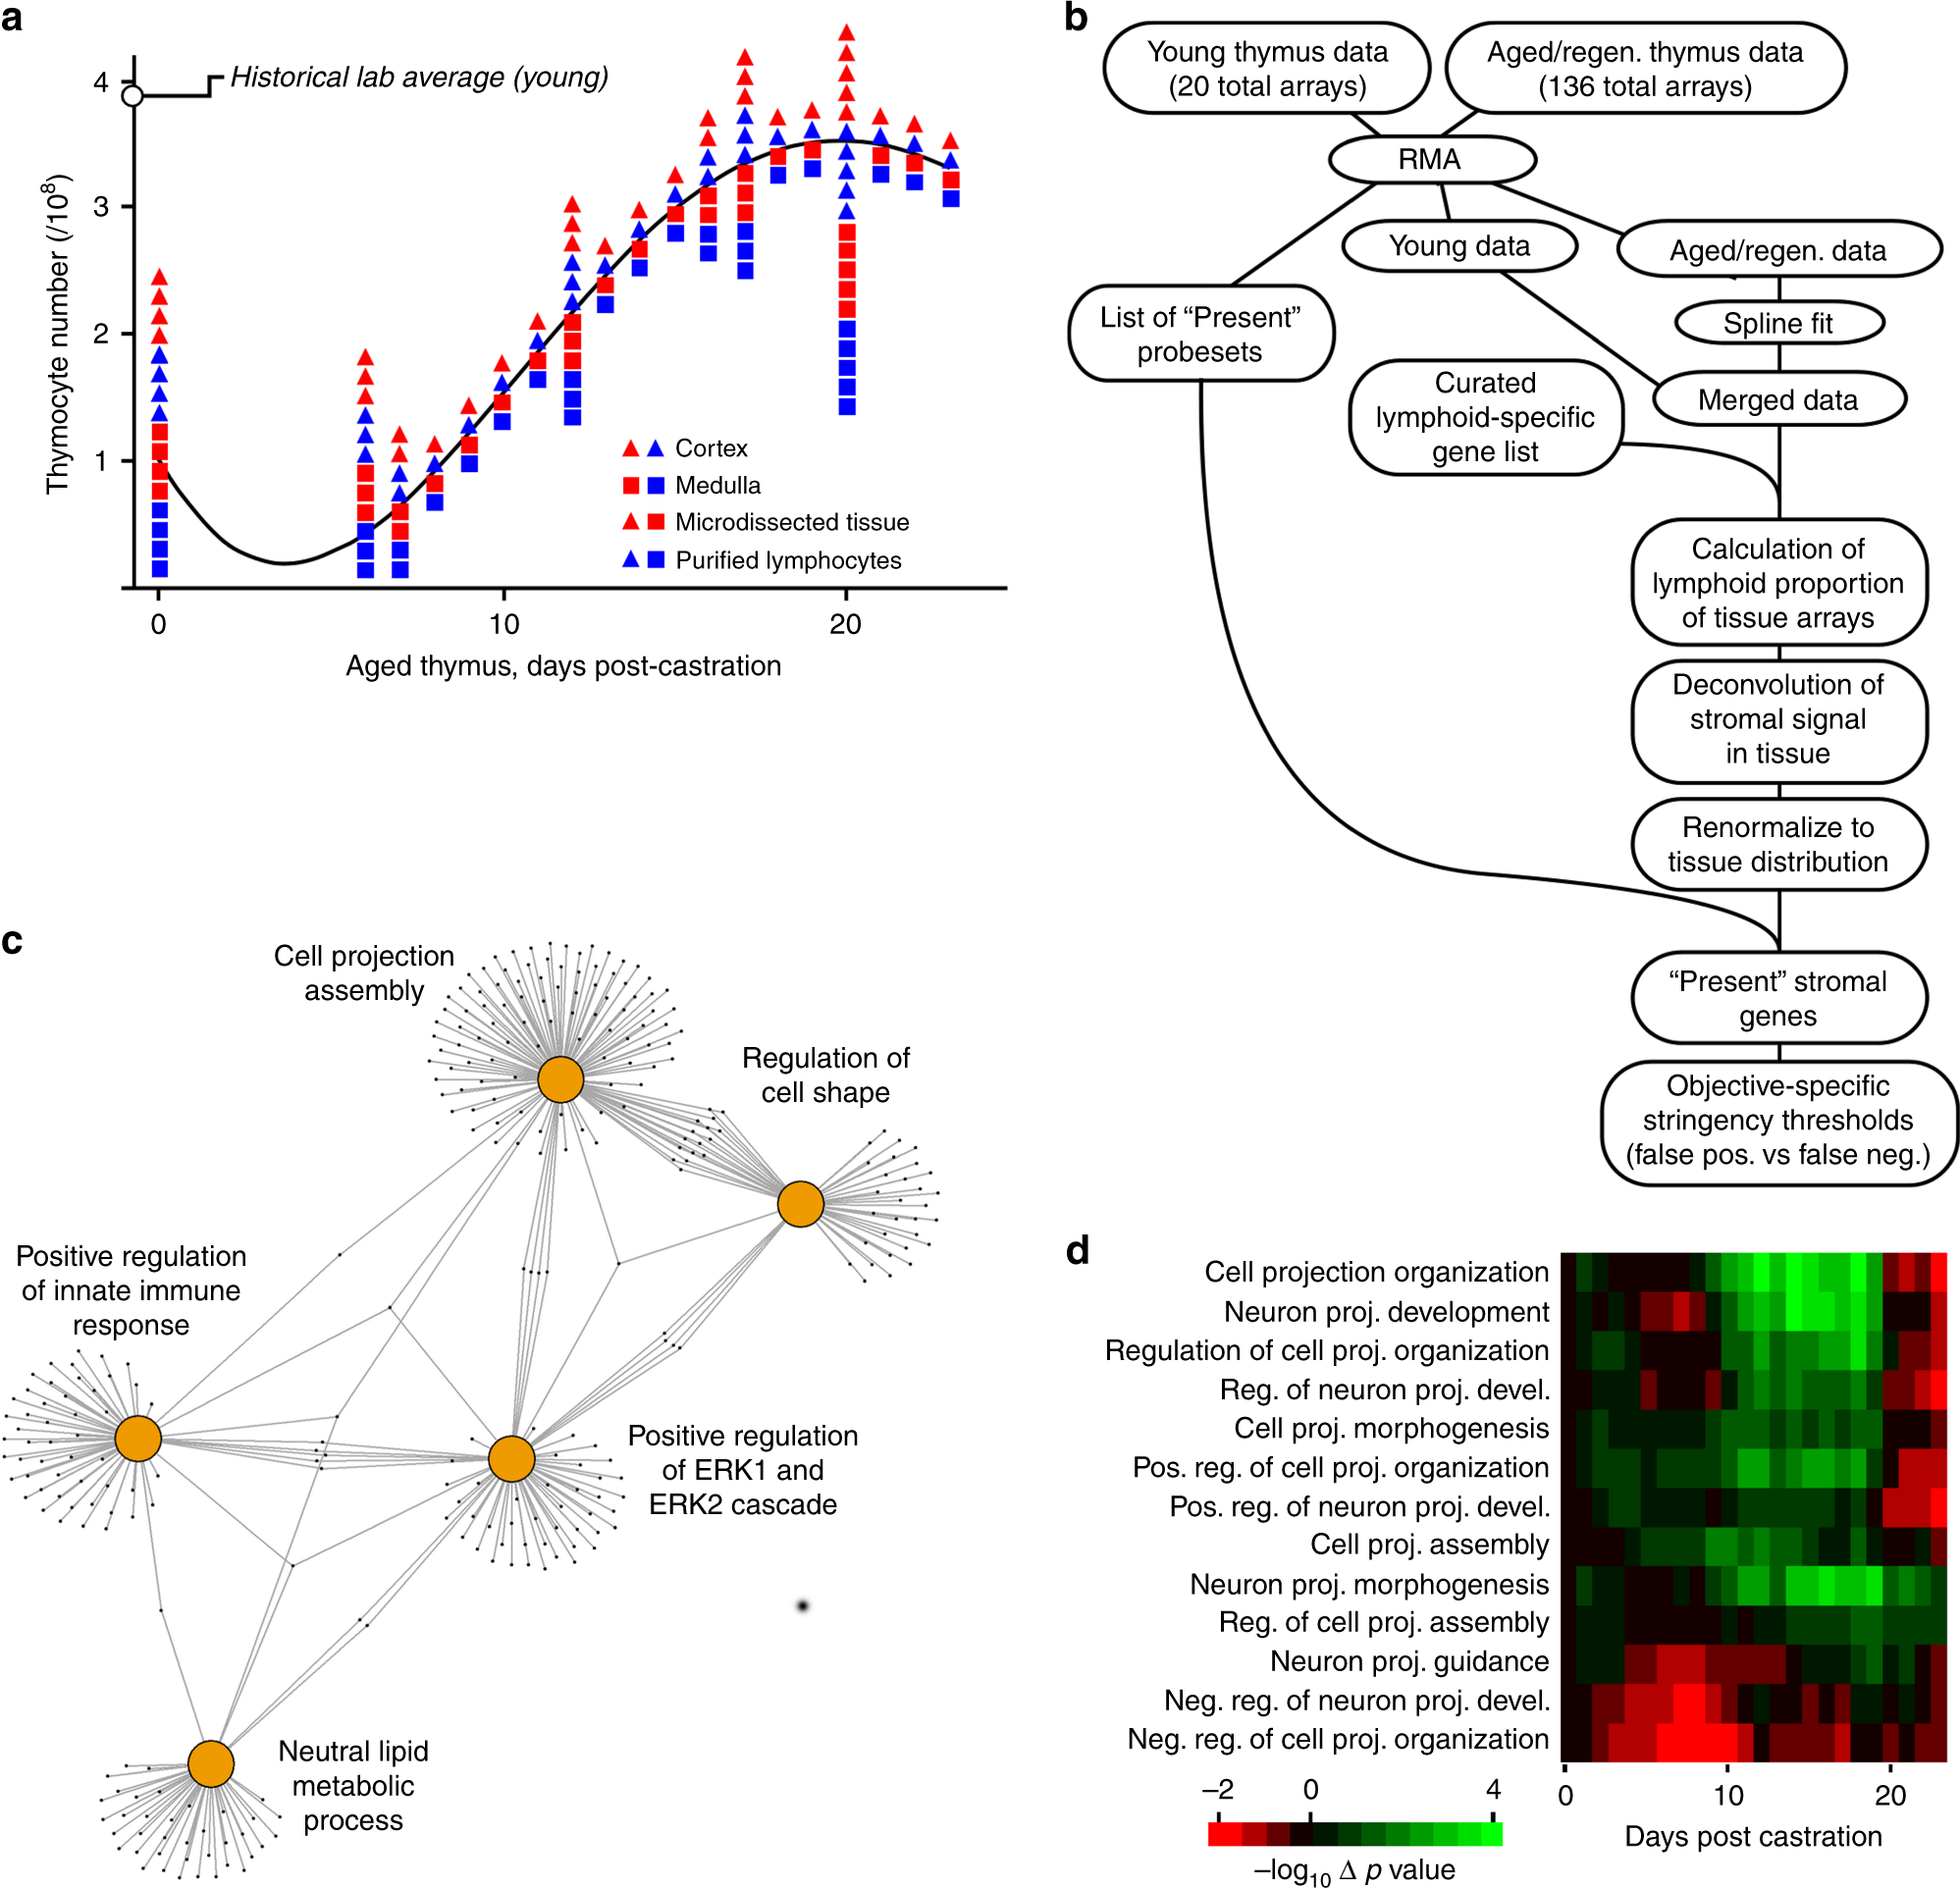
Changes in cell morphology genes dominate the regeneration response. a Summary of 136 microarrays collected during castration-induced regrowth of the age atrophied thymus, mapped onto a regression curve of organ size over time (see text). An additional 20 microarrays from young thymus, 5 for each cell/tissue type, are not indicated (because they are off the time scale), representing a total of 156 microarrays used for this study. Each tissue:lymphoid pair also provides a deconvolved stromal signature (78 total) used for subsequent analysis. b General workflow of steps in the deconvolution of stromal gene expression. c A network map of the top 5 GO:BP categories (200 genes or fewer) indicates a strong bias in cortical stroma towards dynamically regulated genes associated with cell projection morphology. Connections between hubs indicate shared genes. d Mapping of deconvolved thymic stromal transcriptomes onto GO categories related to cell projection (and containing at least 10 total genes). The heat map shows the change in statistical significance (i.e., change in Fisher exact test p value) over time of regeneration, normalized to day 0. There is a negative enrichment of negative regulators early, and a positive enrichment of positive regulators late, further supporting the prediction from non-presumptive analysis that changes in cell shape may play a significant role in the regeneration response
