Fig. 1
From: A tool for functional brain imaging with lifespan compliance

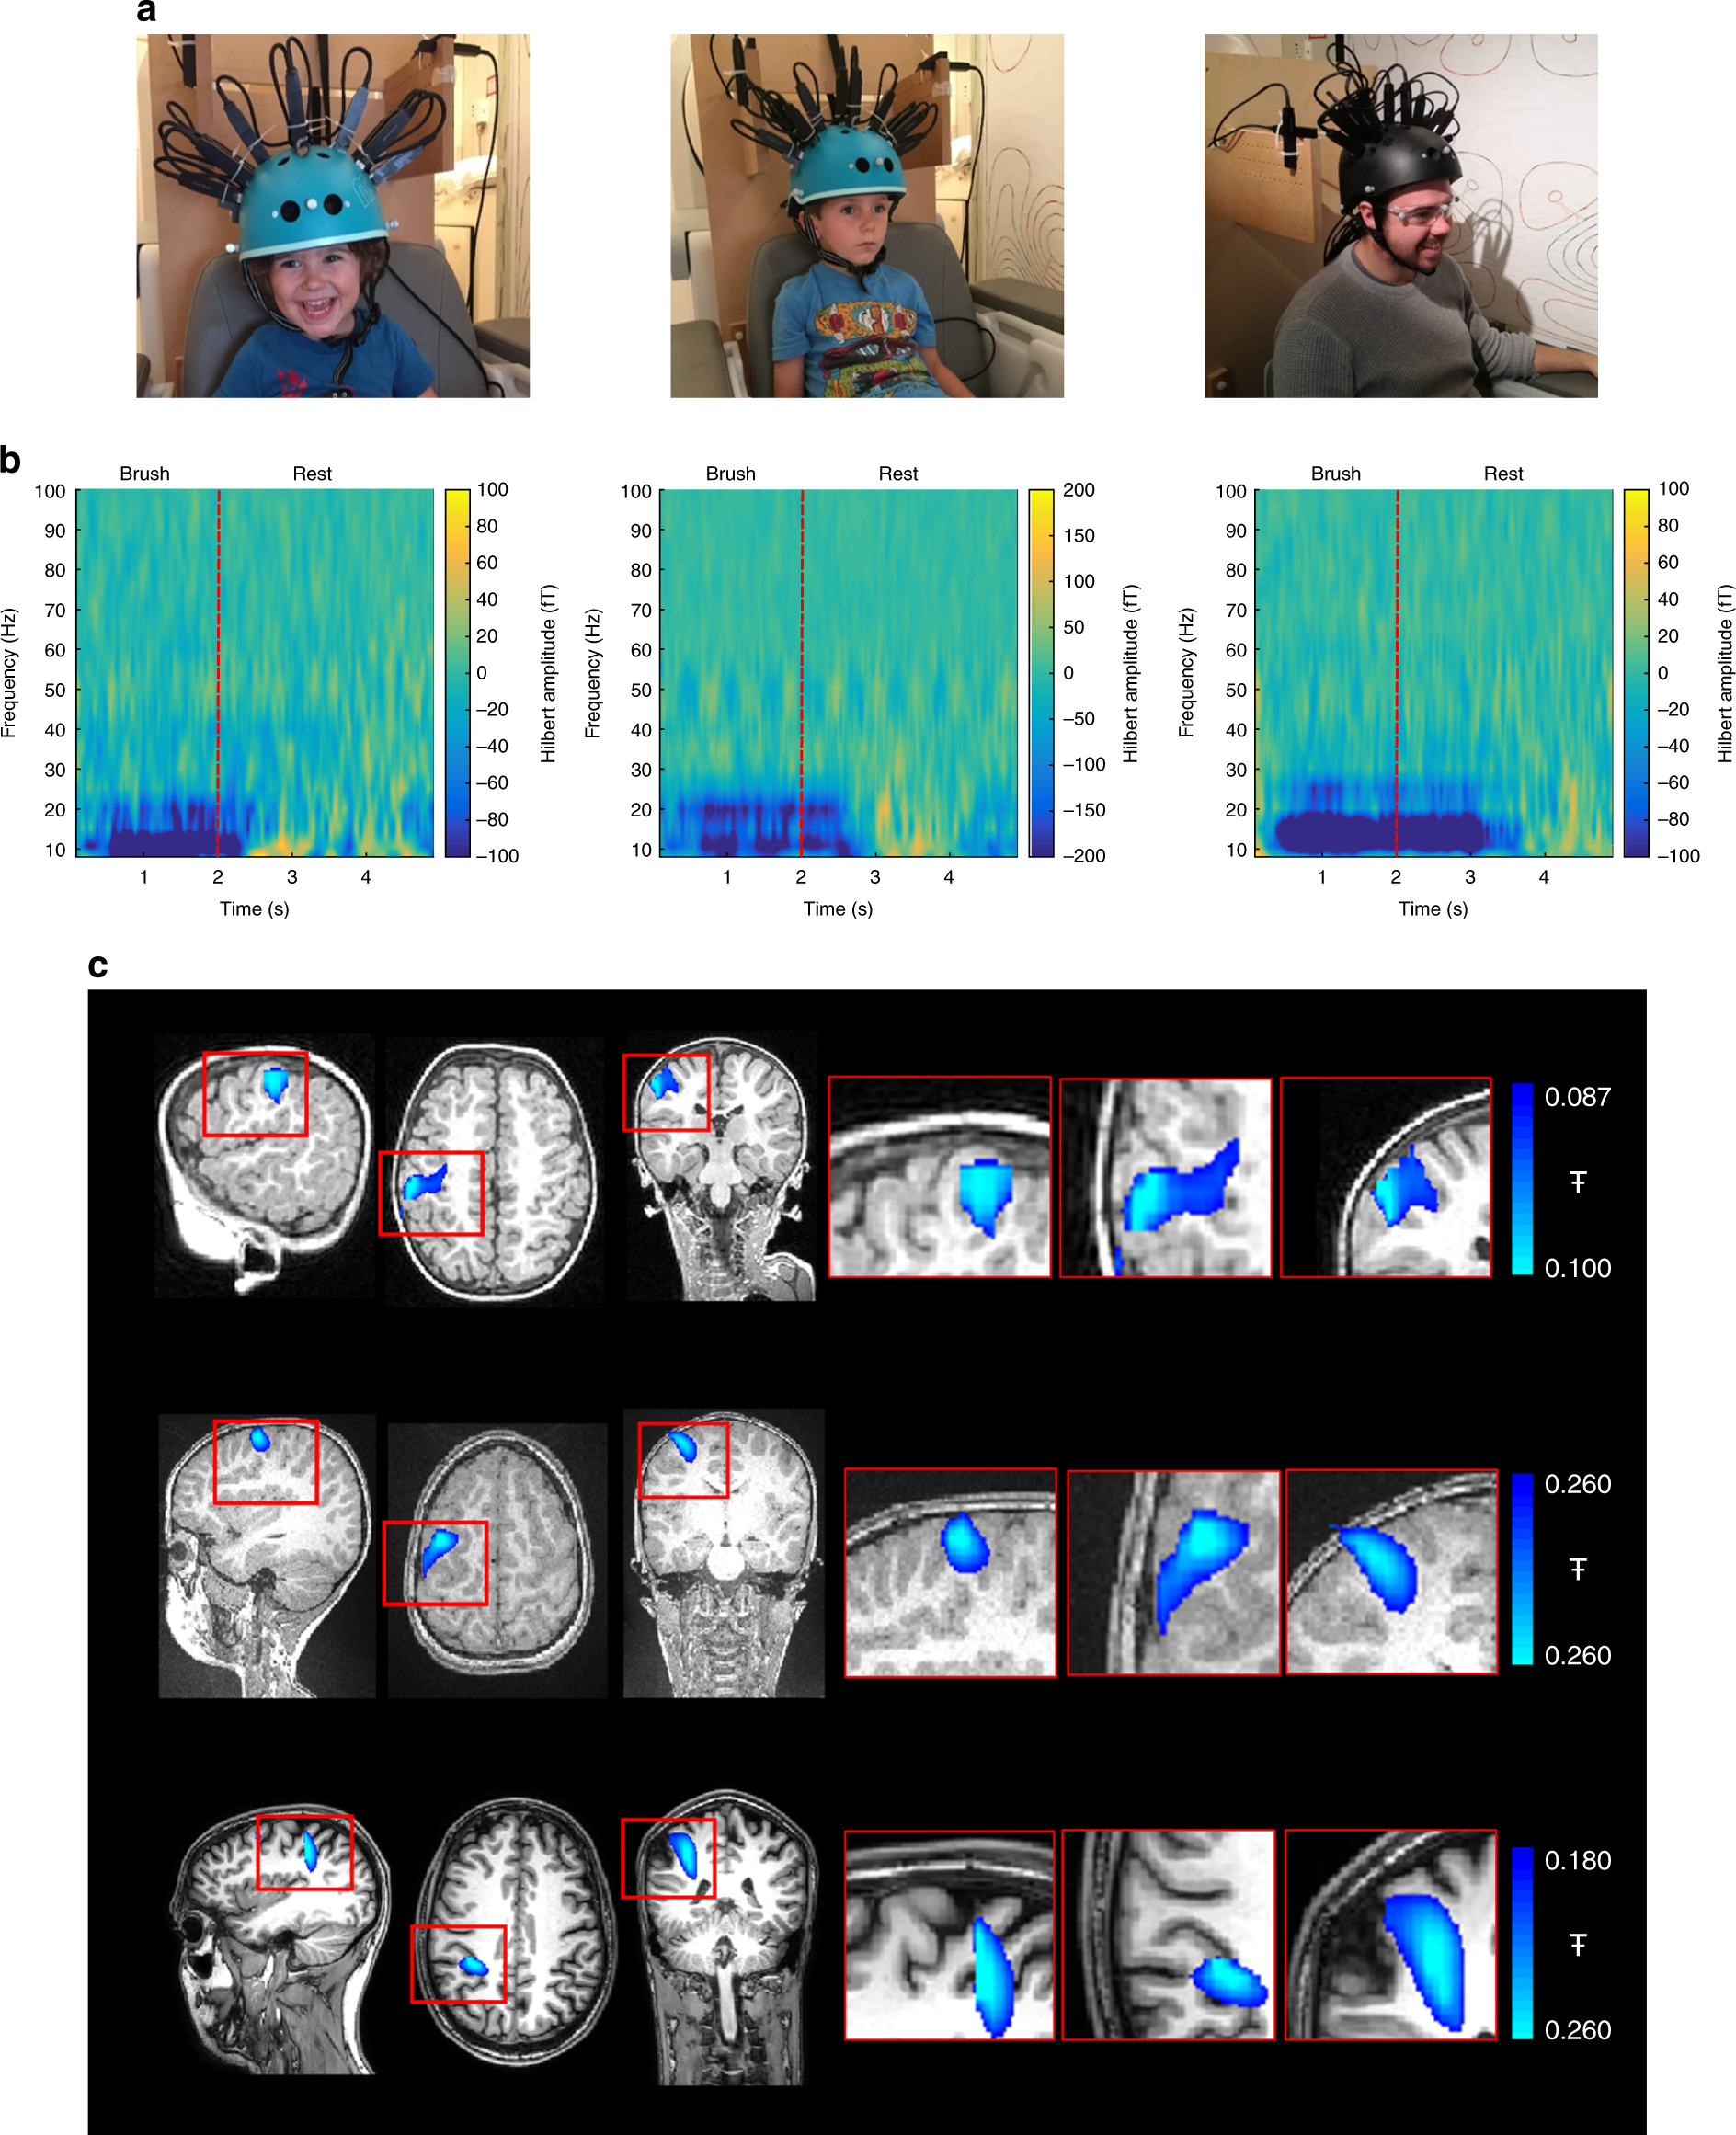
A paediatric MEG system: a Experimental setup for three participants age 2- (left), 5- (centre) and 24-years (right). OPMs, housed in a modified bike helmet, measured the MEG signal. b Time-frequency spectra from a single (synthesised gradiometer) channel. Changes in neural oscillations are shown; blue indicates a reduction in oscillatory amplitude relative to baseline; yellow indicates an increase. Note reduction in beta (13–30 Hz) and mu (8–13 Hz) amplitude. c The spatial signature of beta modulation during the period of tactile stimulation (0 s < t < 2 s) (blue overlay)
