
Fig. 1
From: The chromosome-scale reference genome of black pepper provides insight into piperine biosynthesis
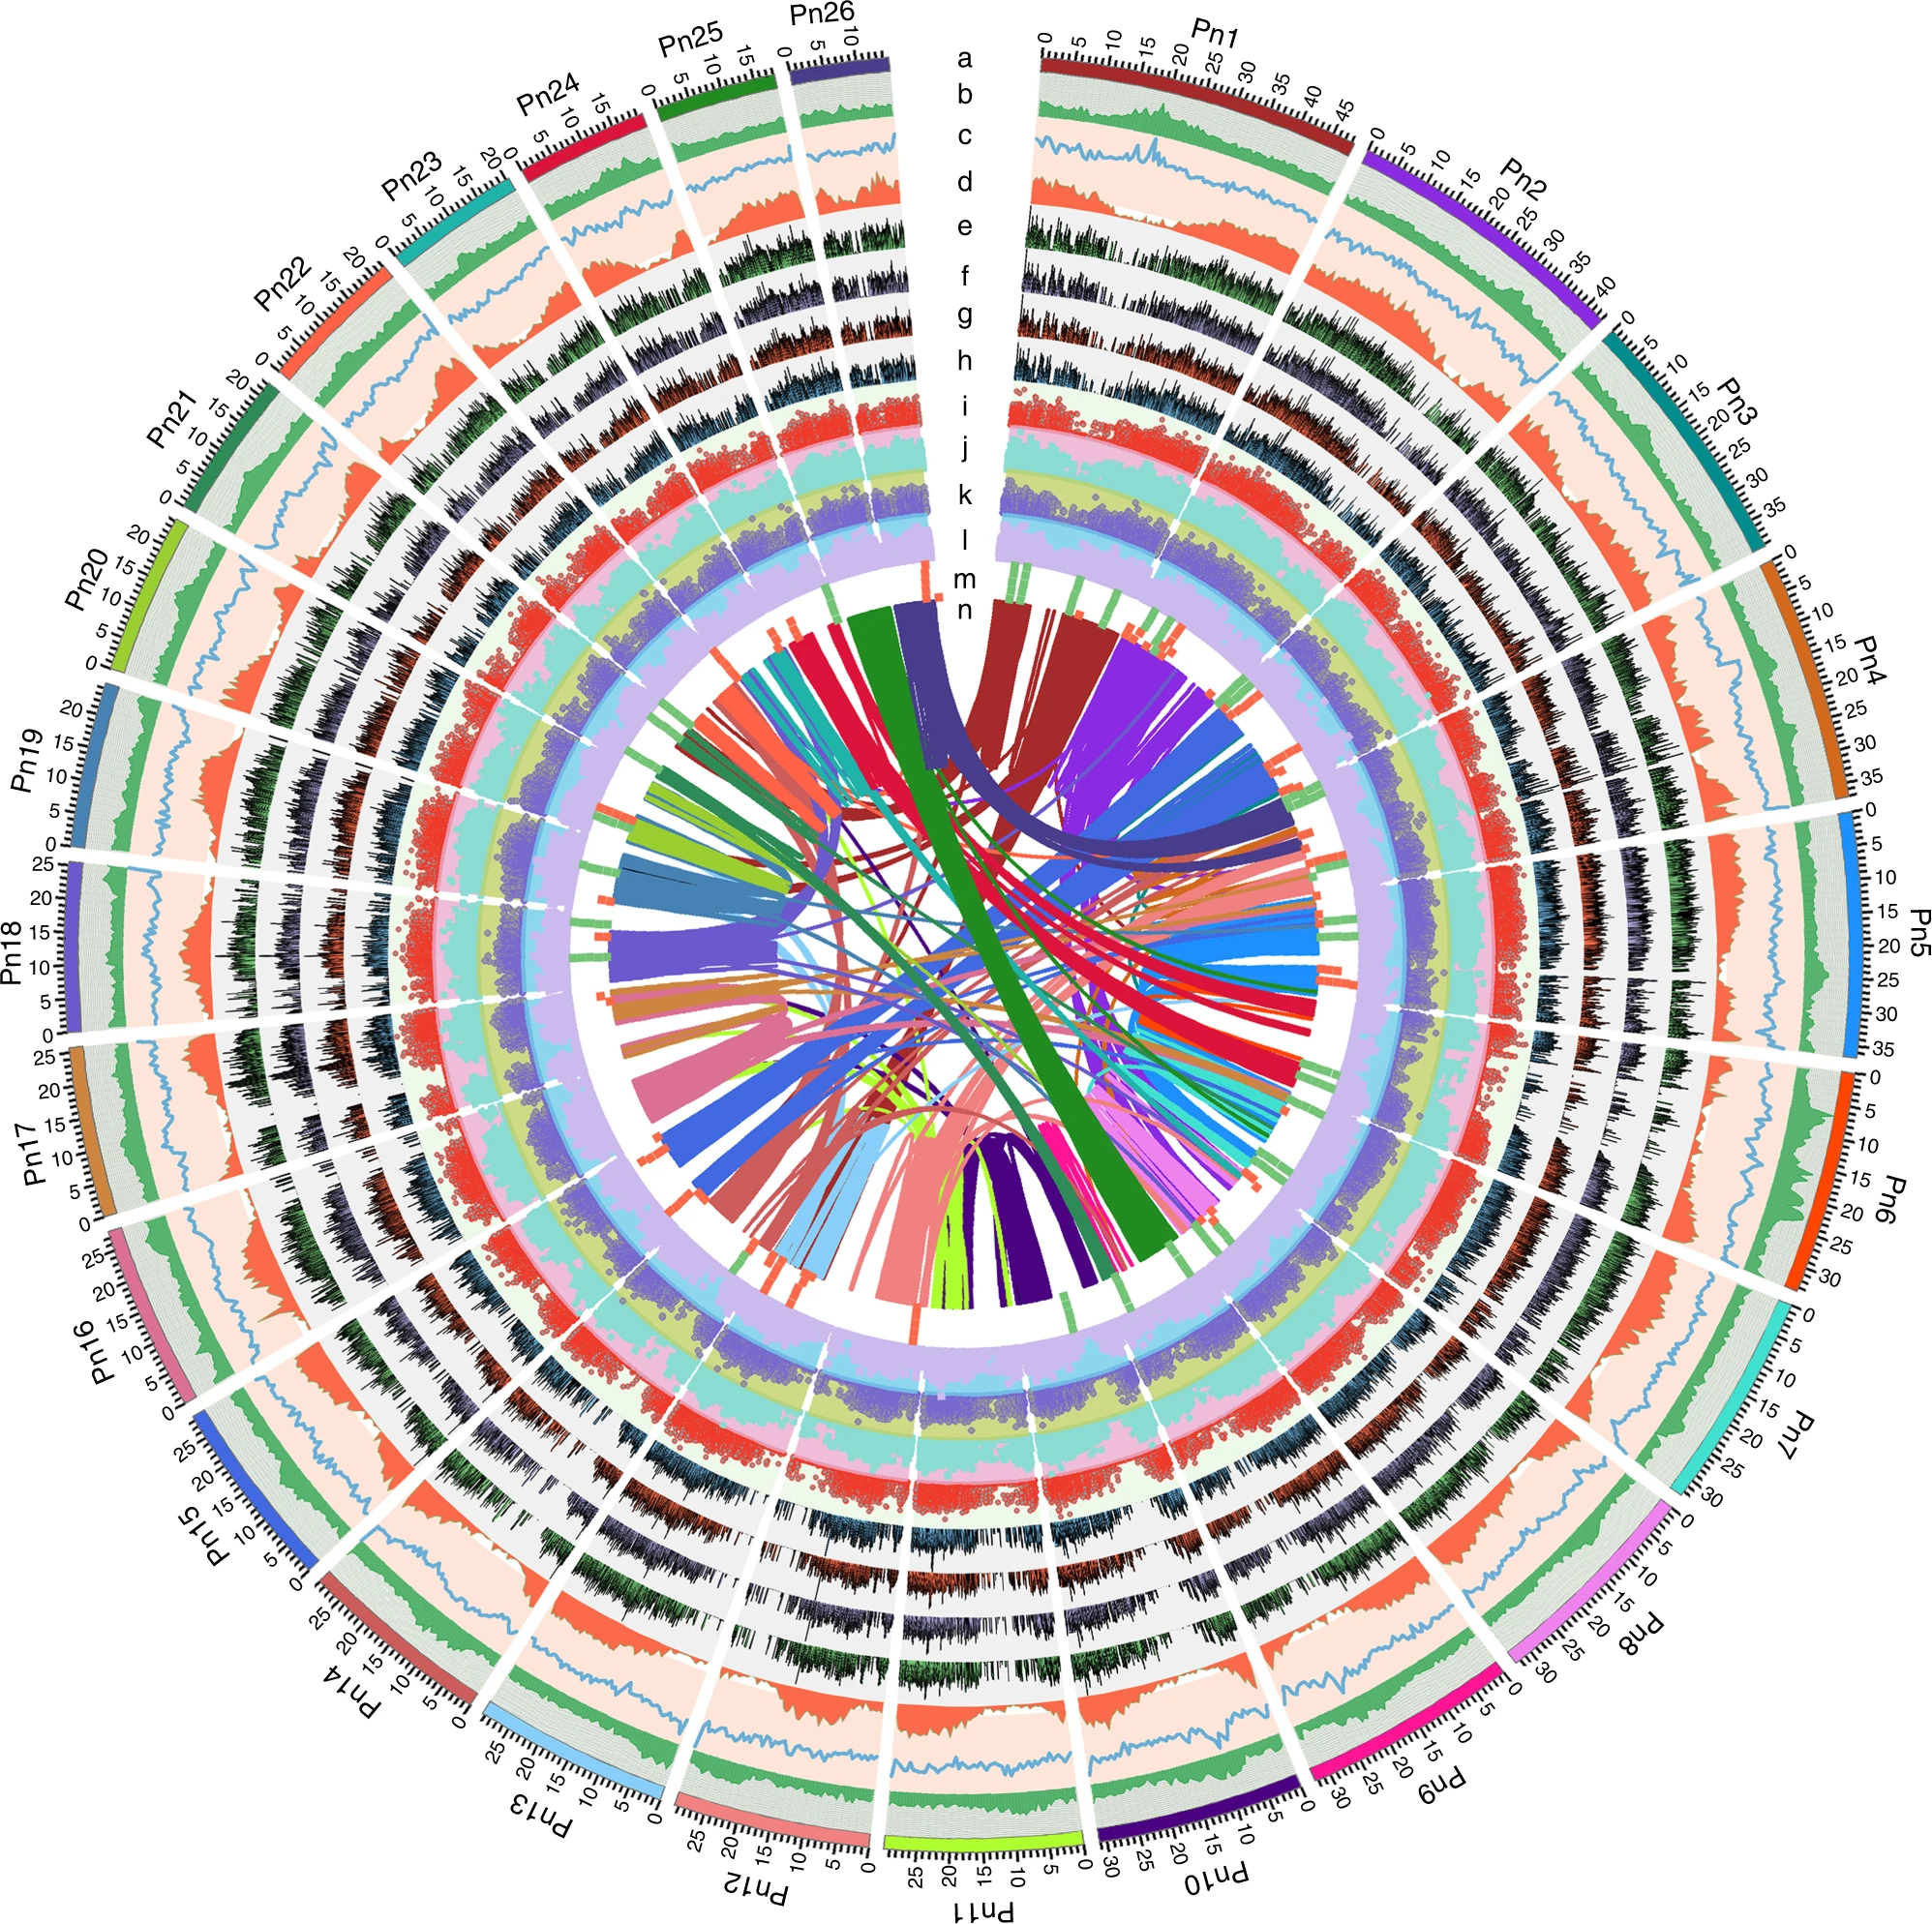
Black pepper genomic landscape of diversity and expression data. a Circular representation of the pseudomolecules. b–d The distribution of the GC density, repeat density and gene density, respectively, with densities calculated in 500 Kb windows. e–l Expression of berry-specific genes (from outside to inside tracks: 2 MAP, 4 MAP, 6 MAP, 8 MAP, root, stem, leaf and flower). m Locations of genes mapped to secondary metabolism (green square) and alkaloid metabolism (red square) pathways. n Syntenic blocks. The band width is proportional to syntenic block size. Source data are provided as a Source Data file
