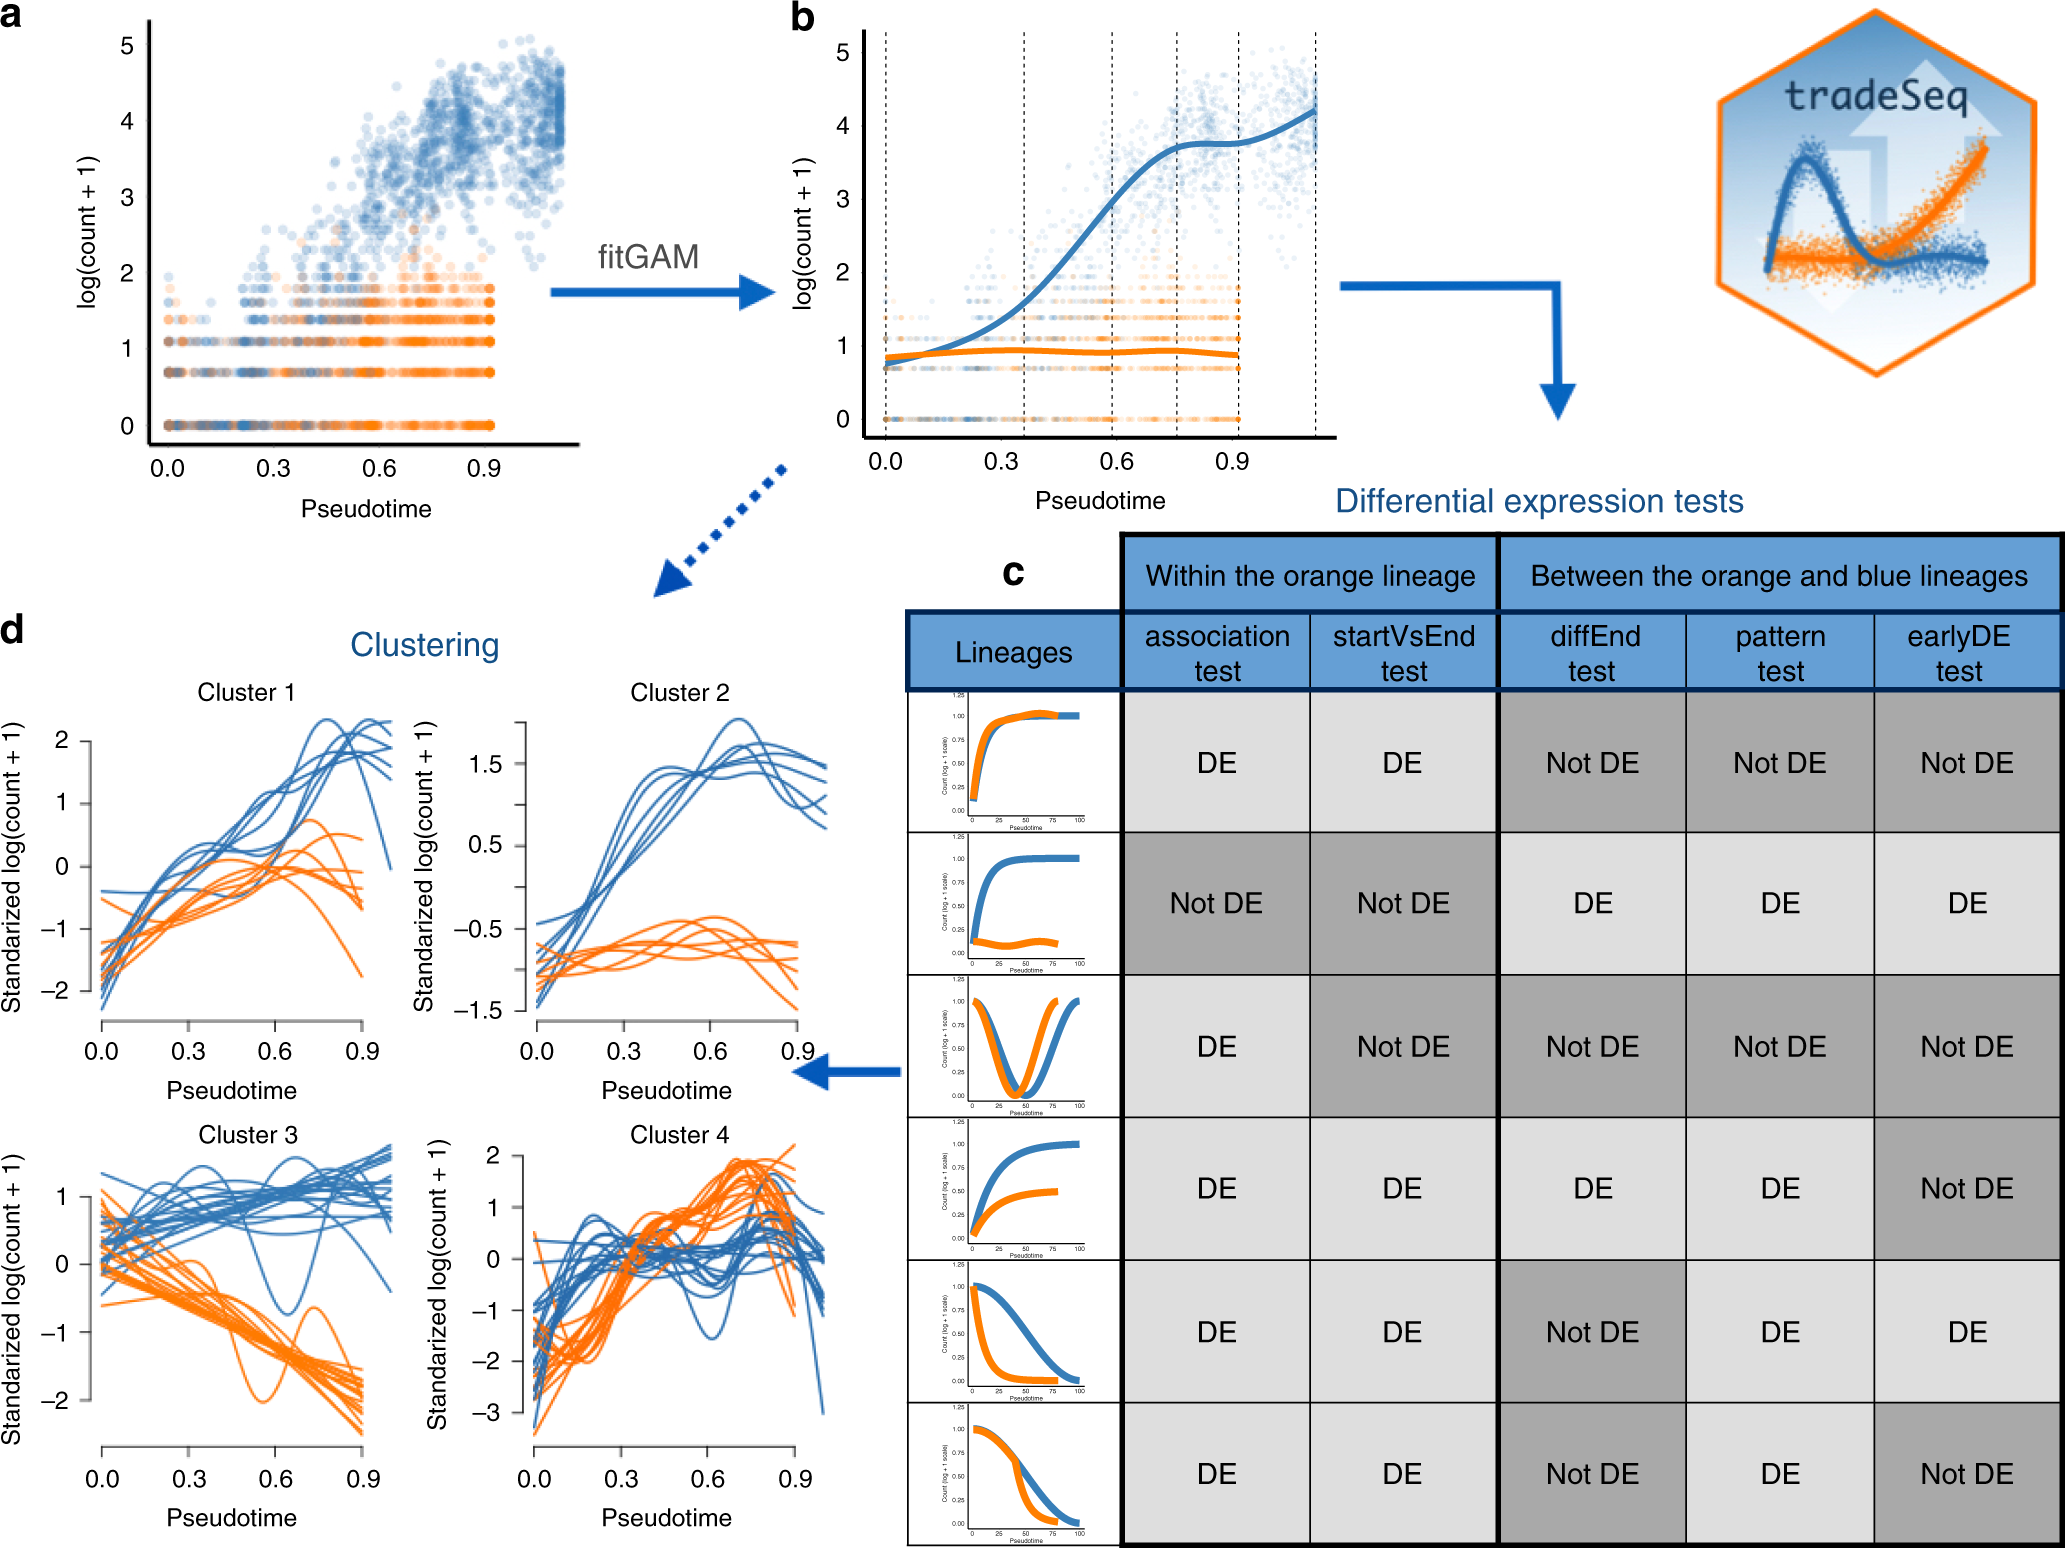
Fig. 1: Overview of tradeSeq functionality.
From: Trajectory-based differential expression analysis for single-cell sequencing data

a A scatterplot of expression measures vs. pseudotimes for a single gene, where each lineage is represented by a different color (top left). b A negative binomial generalized additive model (NB-GAM) is fitted using the fitGAM function. The locations of the knots for the splines are displayed with gray dashed vertical lines. c The NB-GAM can then be used to perform a variety of tests of differential expression within or between lineages. In the table, we assume that the earlyDETest is used to assess differences in expression patterns early on in the lineage, e.g., with option knots = c(1, 2), meaning that we test for differential patterns between the first and second dashed gray lines from panel (b). d Interesting genes can finally be clustered to display the different patterns of expression.
