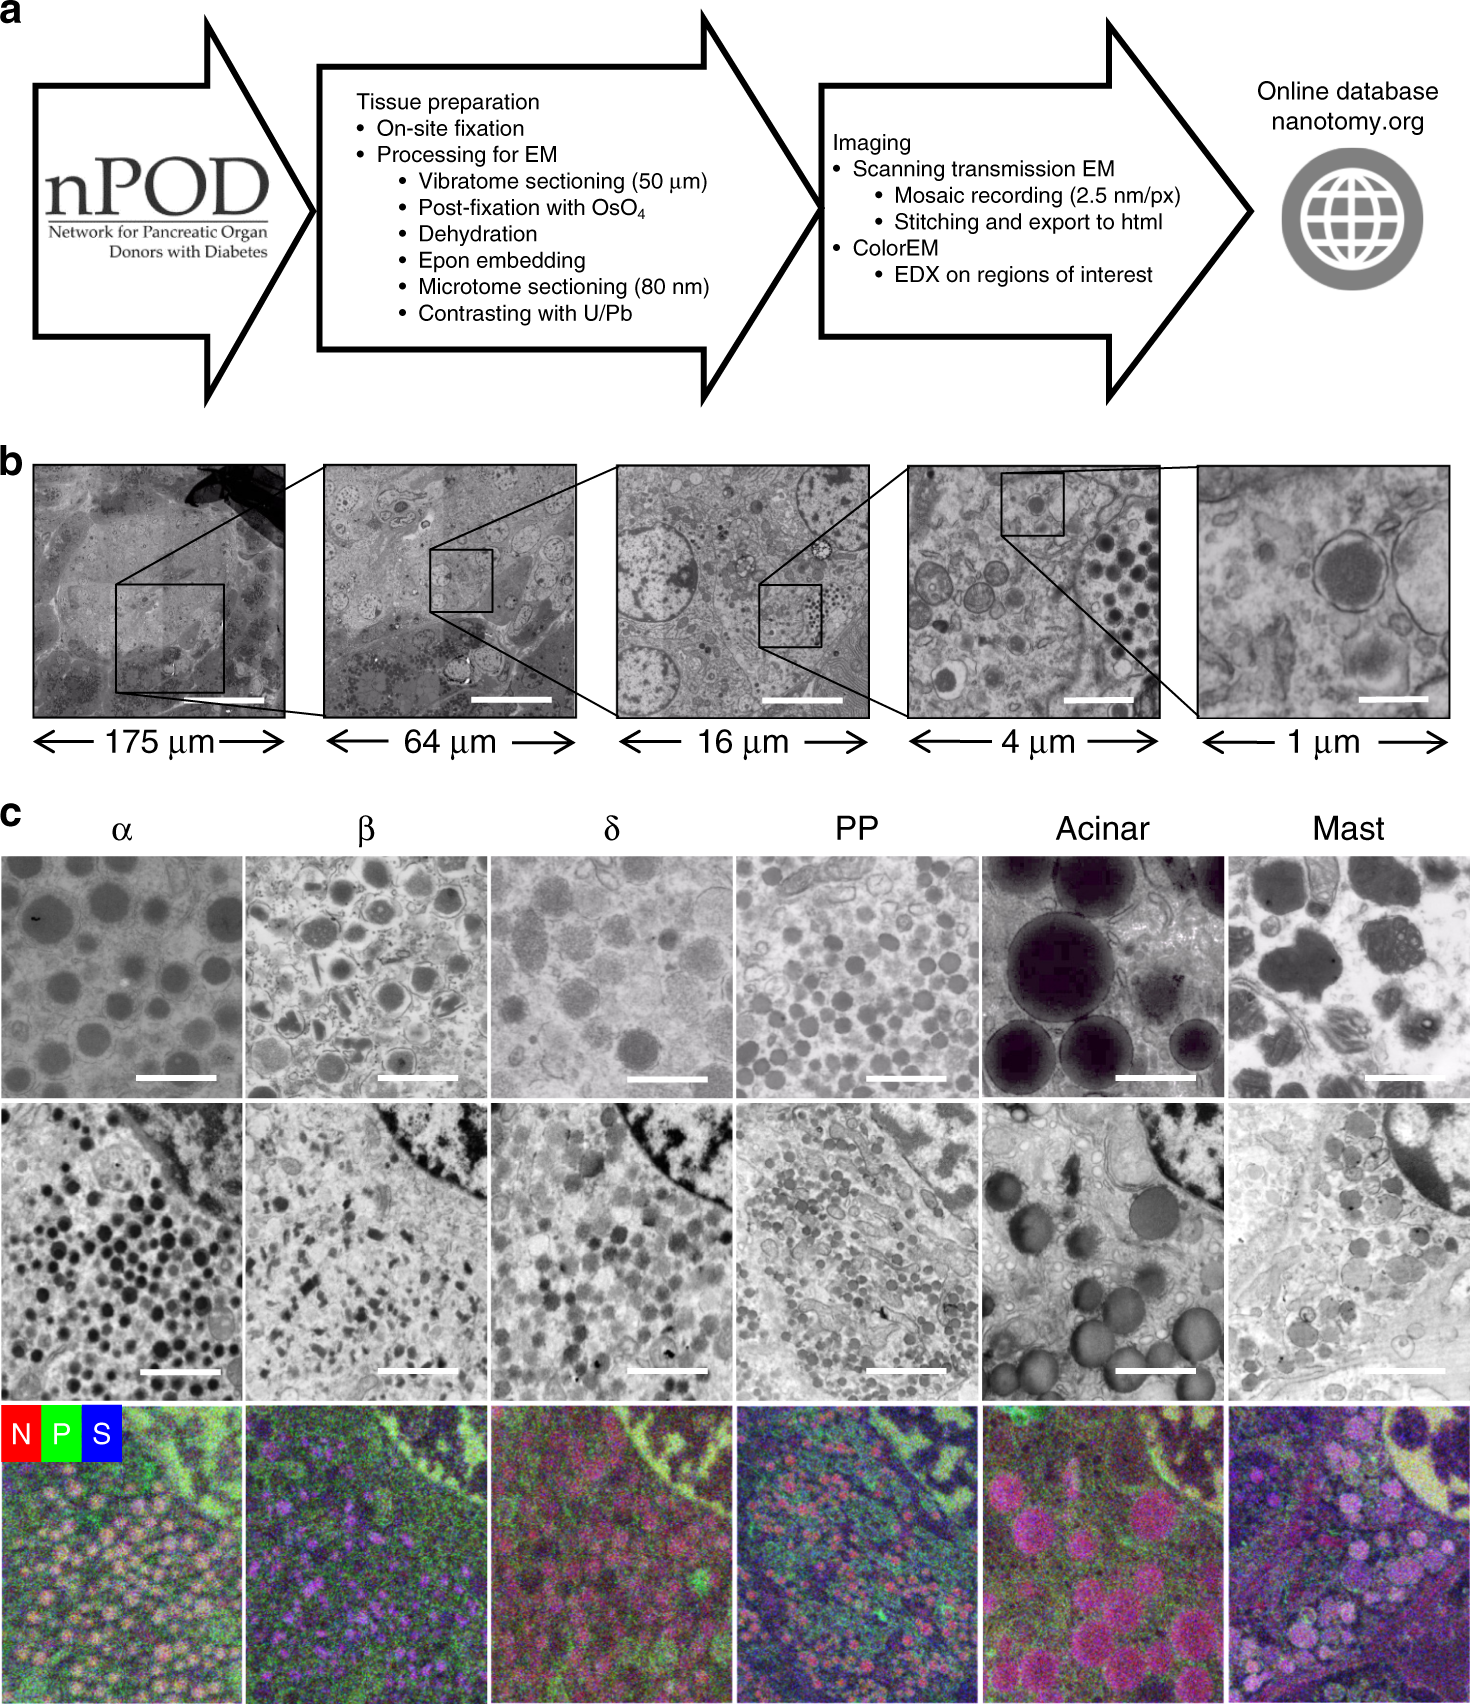
Fig. 1: nPOD nanotomy followed by ColorEM allows zooming into islets up to macromolecular level and label-free identification.
From: Large-scale electron microscopy database for human type 1 diabetes

a Fixed pancreatic samples are received from nPOD and processed for EM. Standard acquisition is at 2.5 nm pixel size. Stitched mosaics are converted to html and uploaded to www.nanotomy.org. Samples may be revisited for elemental analysis (ColorEM). b Overview and molecular detail with nanotomy can only be fully appreciated at www.nanotomy.org. For illustration purposes a step-wise example of islet overview (left), cells with subcellular details like the nucleus (middle); up to organelles including secretory vesicles (right) is shown. c Pancreatic cell types are discriminated based on granule morphology (top panels; see material and methods for description) and elemental composition (bottom row). EDX maps of phosphorus (green), nitrogen (red), and sulfur (blue) are overlaid. Granules of each cell type have high nitrogen (red). Granules of the α-cells are enriched in phosphorus (orange in overlay), β-cell granules with sulfur (purple in overlay), δ-, PP- and exocrine acinar cell granule show mainly nitrogen (red to pink in overlay), and mast cell granules contain sulfur (purple in overlay). Bars: (b, left to right) 50 µm, 20 µm, 4 µm, 1 µm, and 250 nm, c 0.5 µm (upper panels), 1 µm. (lower panels) Upper panel images from donors: 6331 (α), 6130 (β), 6126 (δ, acinar), 6130 (PP), 6087 (mast cell). ColorEM of donors 6126 (α, β, δ, and acinar) and 6130 (PP and mast). Micrographs in b, c are representative and similar results can be obtained from each dataset. Raw EDX data are shown in Supplementary Fig. 1.
