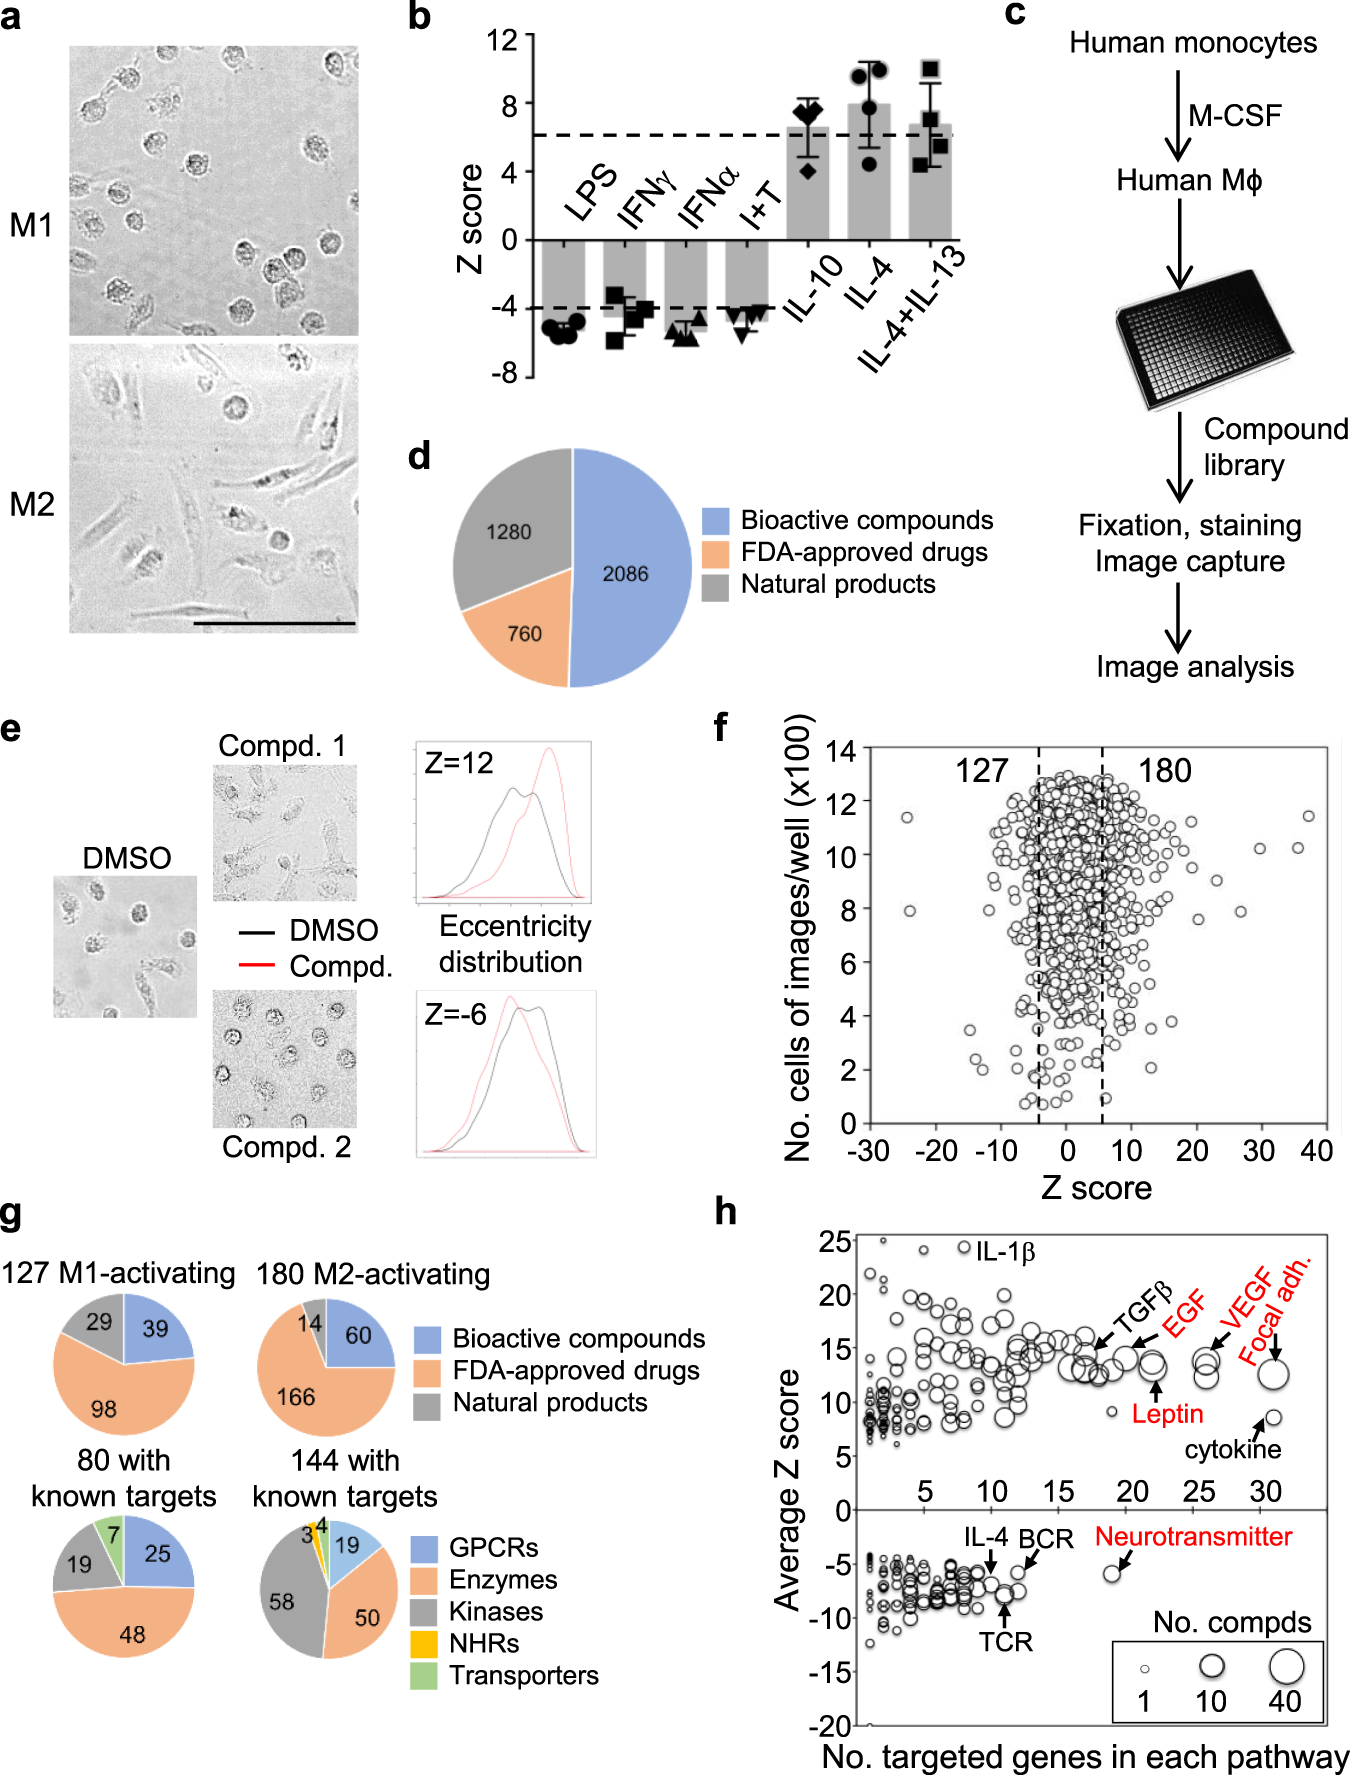
Fig. 1: A high-throughput screen for compounds that activate human macrophages.

a, b hMDMs were cultured for 24 h in the presence of LPS, IFNγ, TNFα, IFNγ plus TNFα (Ι+Τ), IL-10, IL-4, or IL-13. Shown are examples of cell morphologies of M1-activated macrophages by IFNγ and M2-activated macrophages by IL-4 (a) from three independent experiments and calculated Z-scores for each stimulus (b) from four independent experiments. Scale bar: 100 μm. Data are presented as mean ± sd. The Z-score was calculated by T-test to measure the difference of cell morphology between treatment and control. Stimuli had negative Z-scores when induced cells to round morphology and positive scores when induced cells to elongated morphology. c The flowchart of high-throughput screen and data analysis. Equally mixed human monocytes isolated from fresh blood of four healthy donors were cultured in vitro with 50 ng/mL M-CSF for 7 days. hMDMs were trypsinized and plated on 384-well plates (5000 cells/well in 50 μL). Cells were recovered in 10 ng/mL M-CSF for 16 h and then treated with compounds for 24 h. Cells were washed, fixed, and stained with phalloidin and DAPI. The plates were scanned with a high-content microscope with six fields per well to quantify the cell number and cell morphology. d Composition of compound libraries used in the screen. e Examples of cell shape changes induced by two compounds and their corresponding Z-scores as compared to DMSO controls. The cell eccentricity was calculated to measure the cell morphology. The Z-score was calculated by T-test to measure the difference in cell morphologies between each compound and DMSO control. f Plot of Z-scores of 4126 compounds and number of cells captured in each well. The dash lines are the cutoffs for M1 activation (left) and M2 activation (right) based on the average of Z-scores from b. g Classification of identified compounds based on their origin and function of their known targets. h Pathway analysis of known targets of identified M1- or M2-activating compounds. Each dot is one specific pathway having protein targets by compounds and dot size refer to the number of compounds. The average Z-score (y-axis) and number of compounds that have protein targets belongs to one specific pathway are plotted. Selected known (black) and new (red) pathways associated with macrophage activation are indicated.
