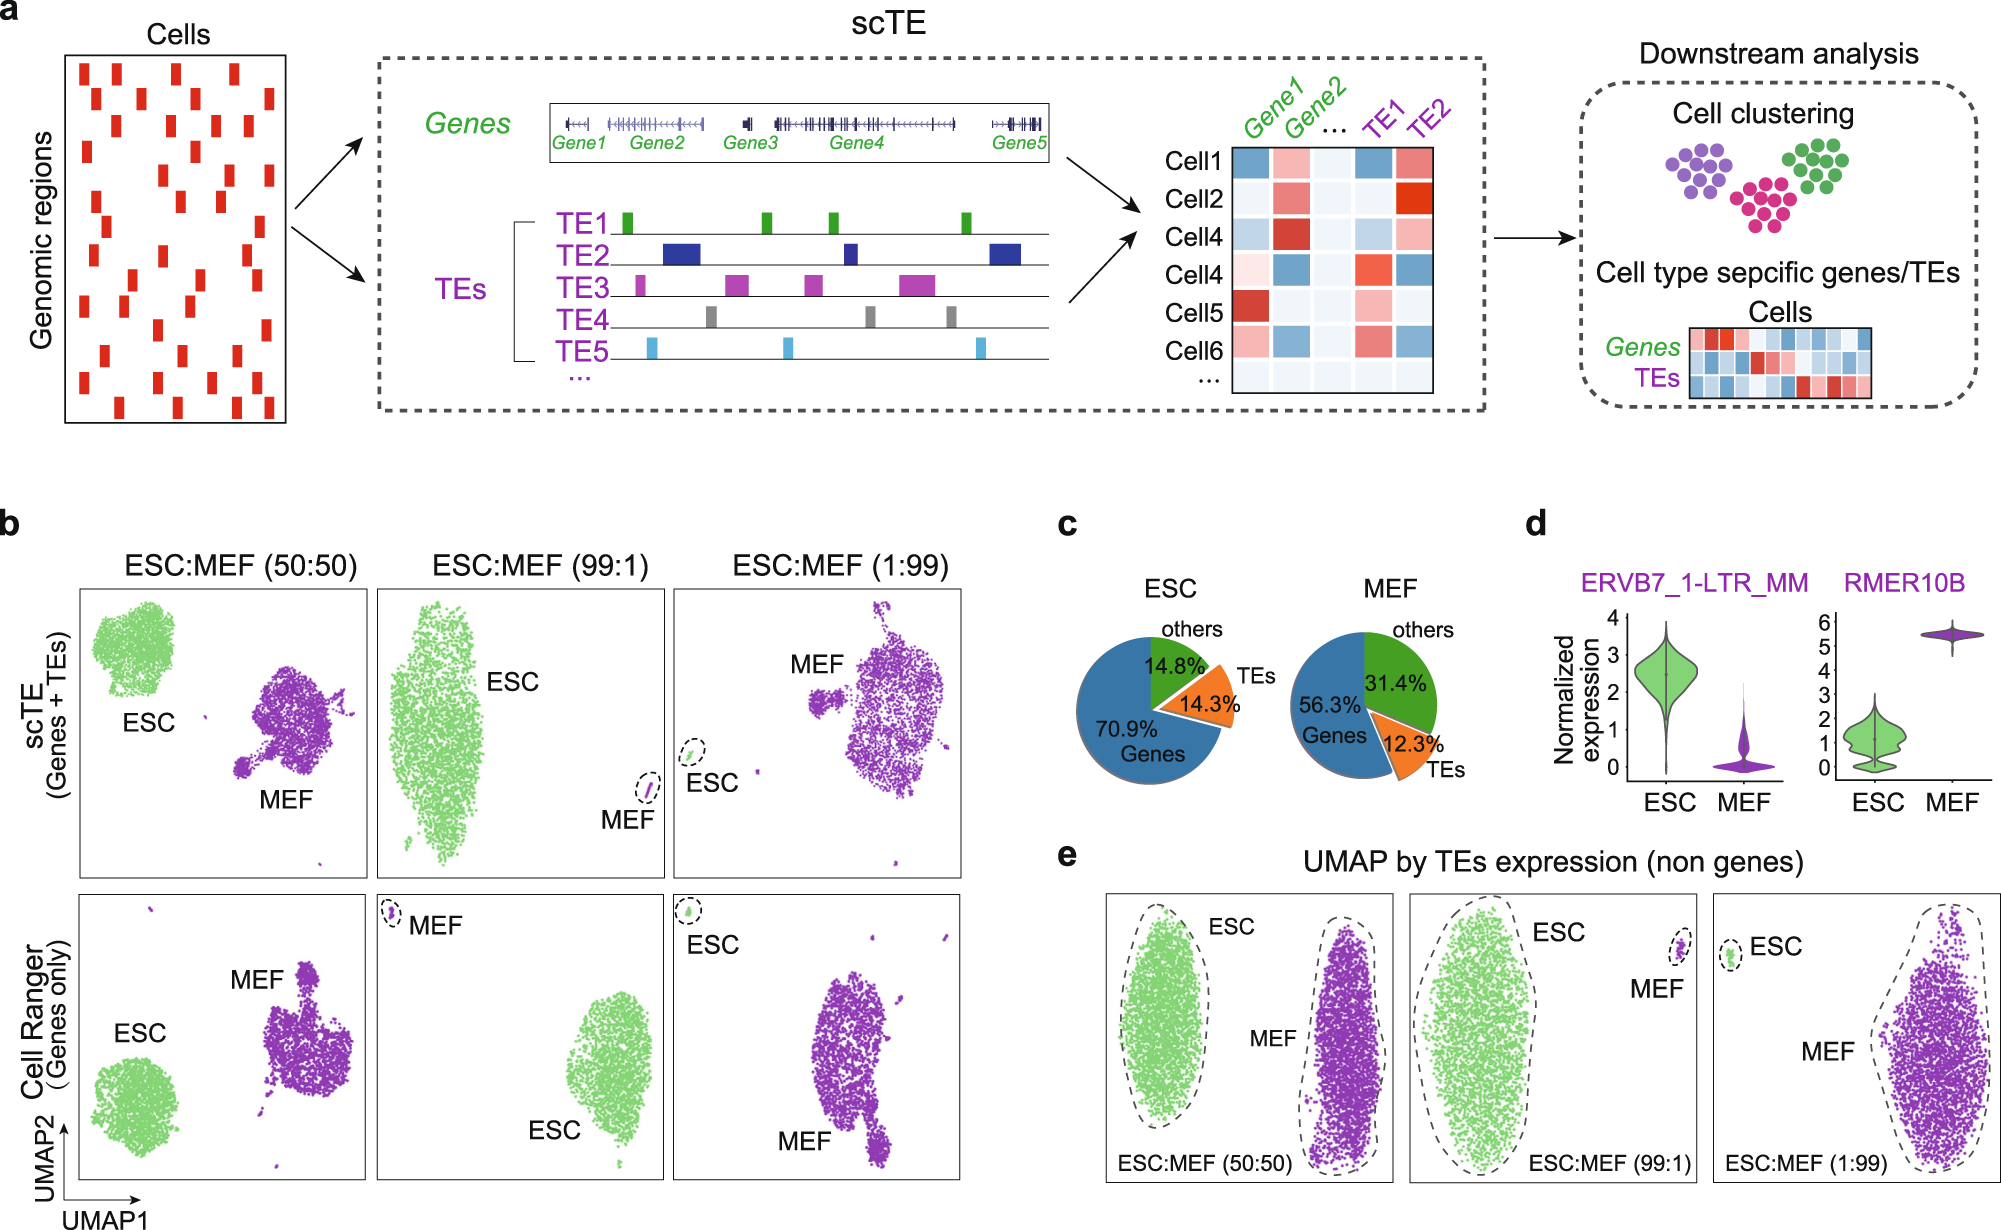
Fig. 1: scTE workflow and applications.

a Schematic of the workings of scTE. For scRNA-seq data the reads are mapped to the genome, and assigned to either a gene, or a metagene model of a TE. Multimapping read data will assign the best mapping read to a type of TE. Reads are always mapped to a gene first, and then a TE if no gene is found. The resulting assignments are then collapsed into a matrix of read counts for each cell, versus each gene/TE. This matrix can be used in downstream applications. Genes are colored in green and TEs are colored in purple in all figures. b UMAP plot showing mixtures of MEFs and ESCs in the indicated ratios. The top panels show scTE analysis, the lower panels show Cell Ranger analysis results. Cells are colored by their sample of origin. c Percentage of reads mapping to genes, TEs or other regions of the genome in MEFs and ESCs. d Violin plot showing the expression of selected TEs in MEFs and ESCs. e As in (b), but only TE expression was used.
