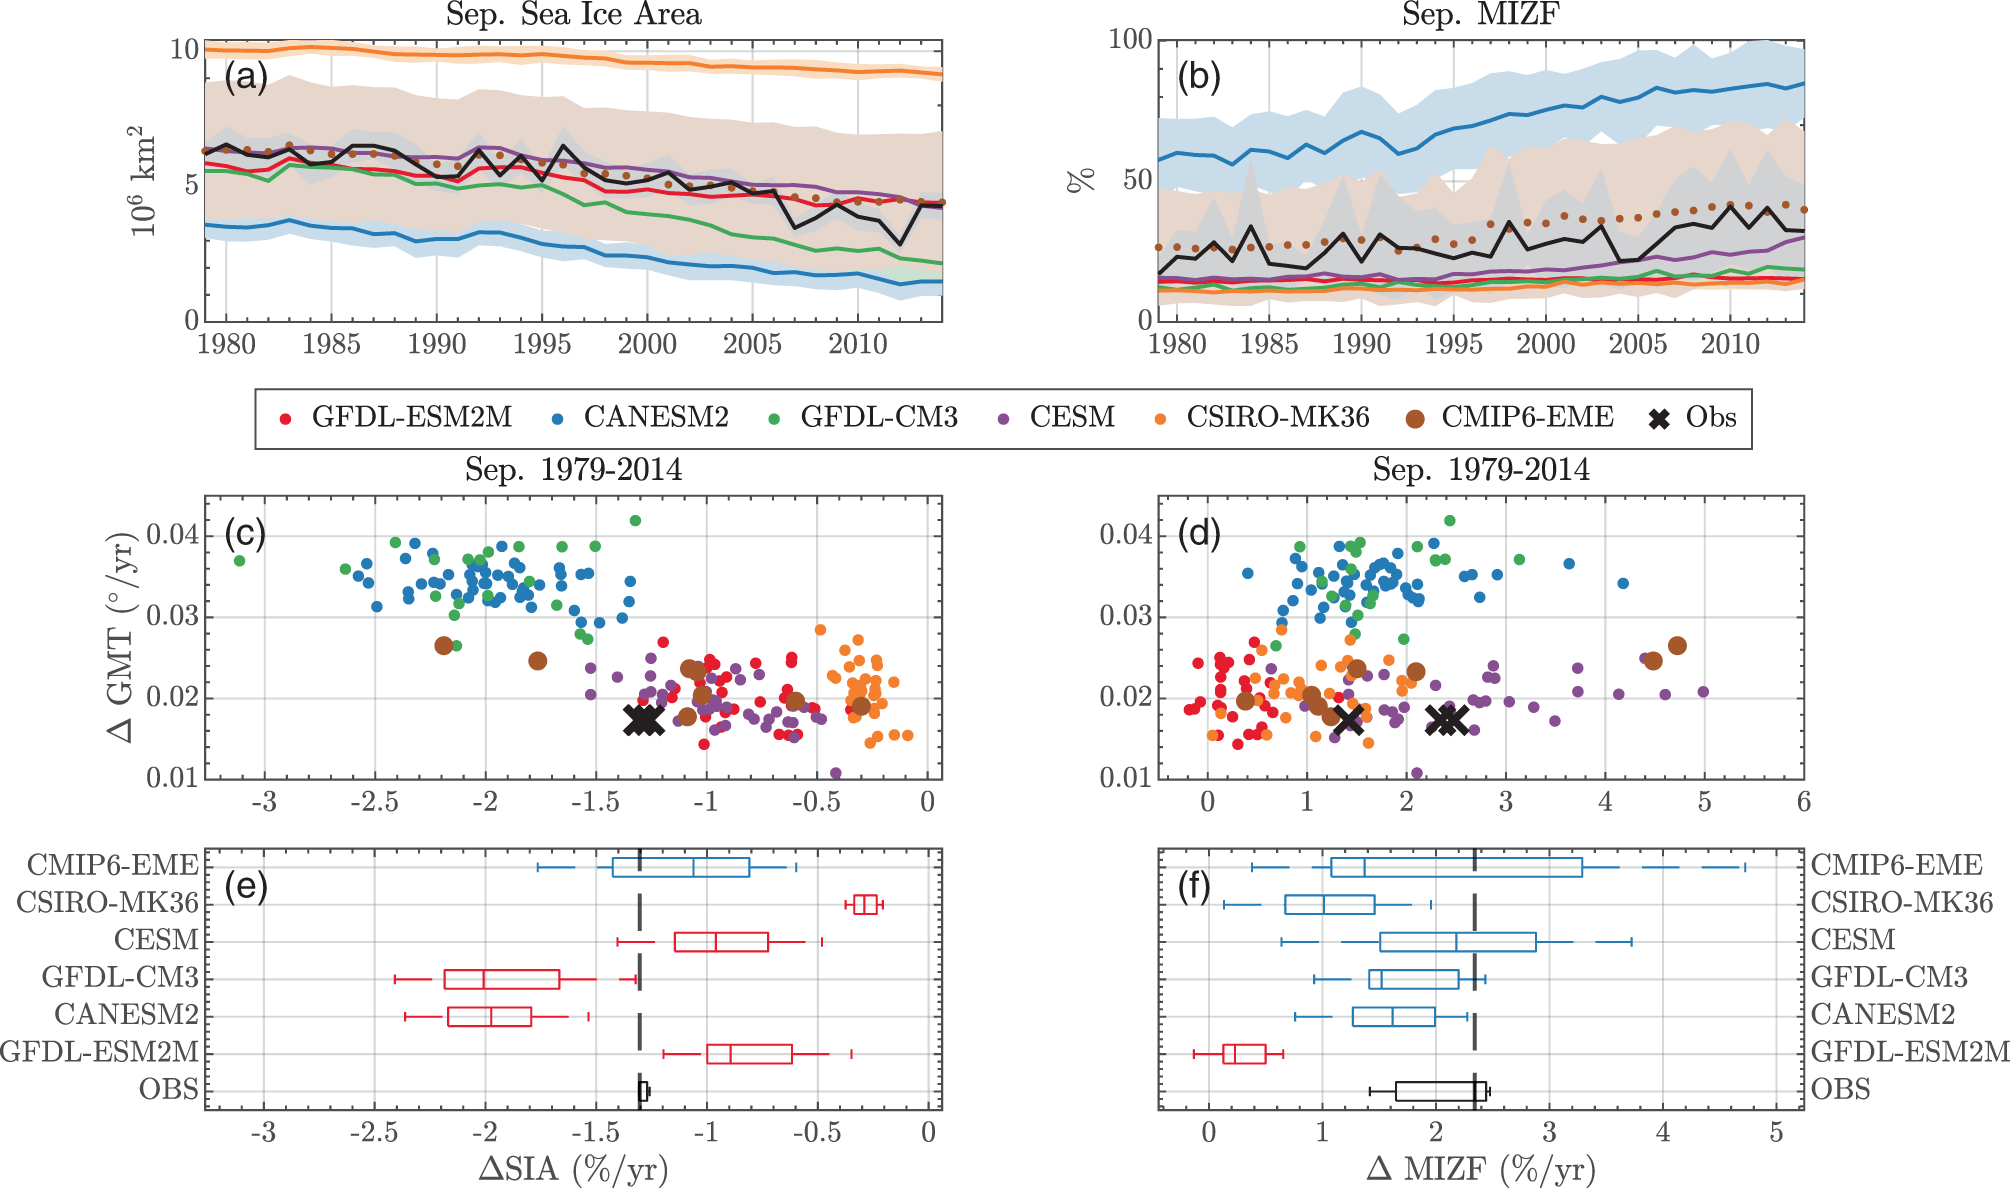
Fig. 1: September sea ice statistics, sensitivities, and trends.
From: Marginal ice zone fraction benchmarks sea ice and climate model skill

a Annually averaged SIA for all CLIVAR-LE and CMIP6-EME simulations. Solid lines are CLIVAR-LE ensemble means. Dotted line is the CMIP6-EME ensemble mean. Colored areas are one unbiased sample standard deviation from ensemble means (see “Methods”). Black lines and shaded region is the same for observations and observational uncertainty. c Scatter plot of 1979–2014 trend in global mean temperature vs normalized trend in sea-ice area (expressed as a percentage per year). Crosses are observations. e Box plots of sea-ice area trends for models shown above and observations. Whiskers extend the boxes ± 3 standard deviations from the mean in each month and vertical line is ensemble median. Dashed black line extends the median observed trend. Blue boxes are plausible estimates given the observation (black boxes, see methods), red boxes are implausible estimates (at p = 0.01). b, d, f Same as (e) but for MIZF.
