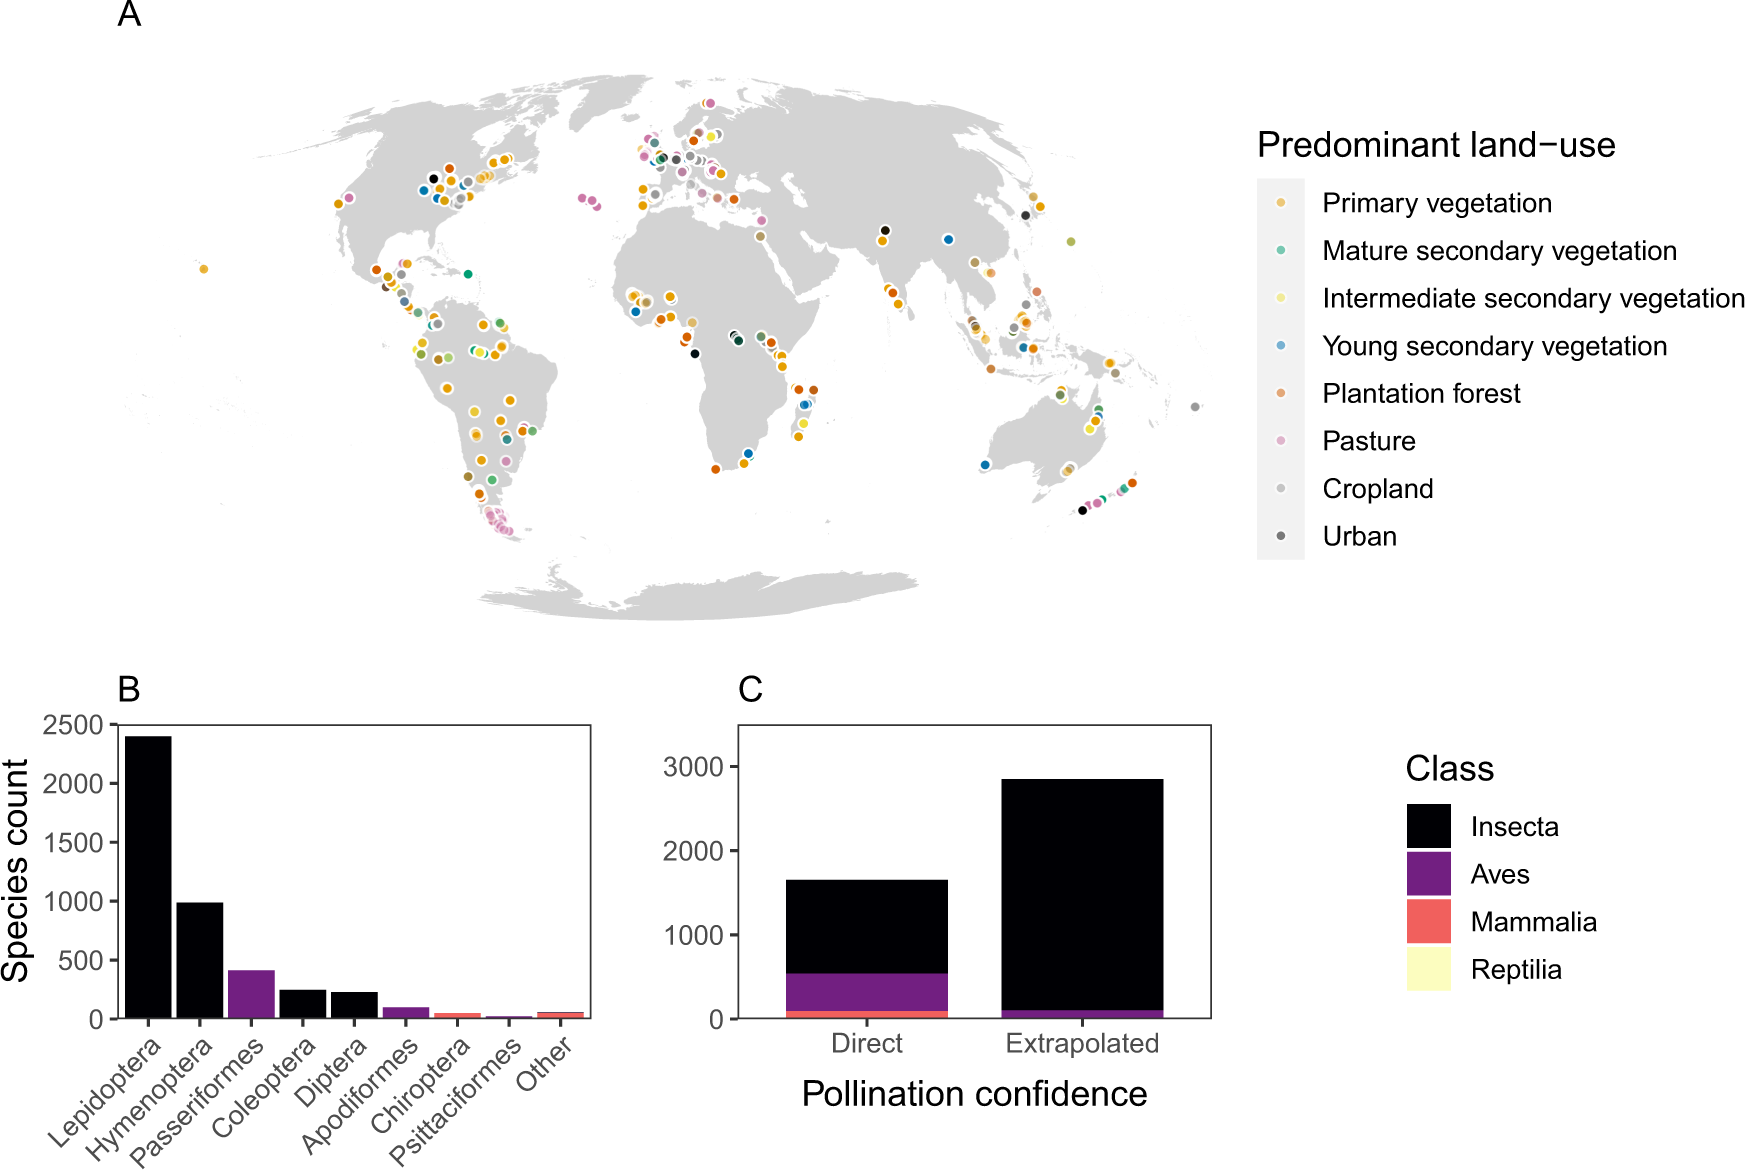
Fig. 1: Data on species in the PREDICTS database identified as likely pollinators, after automatic text-mining, manual filtering, and expert consultation.
From: Global effects of land-use intensity on local pollinator biodiversity

A The global distribution of PREDICTS sites containing likely pollinating species, for which both the land-use type and intensity of that site are known (nsites = 8639). Colours represent land-use type: orange (primary vegetation), green (mature secondary vegetation), yellow (intermediate secondary vegetation), blue (young secondary vegetation), dark orange (plantation forest), pink (pasture), grey (cropland), and black (urban). B The taxonomic distribution of likely pollinating species in PREDICTS for all sites (nspecies = 4502). The number of species indicated here will be an underestimate of the number of pollinating species in PREDICTS, since this figure only includes records for which there is a full scientific binomial in the database. Some biodiversity records in the PREDICTS database are recorded above the level of species. C The source of information (direct evidence at the genus level or extrapolated to groups based on information for groups at higher taxonomic levels) for pollinators in PREDICTS, broken down by taxonomic class. In both B and C, there are four taxonomic classes: Insecta (black), Aves (purple), Mammalia (red), and Reptilia (yellow). The reptiles are represented by only 5 species with ‘Direct’ confidence (see Supplementary Table 2).
