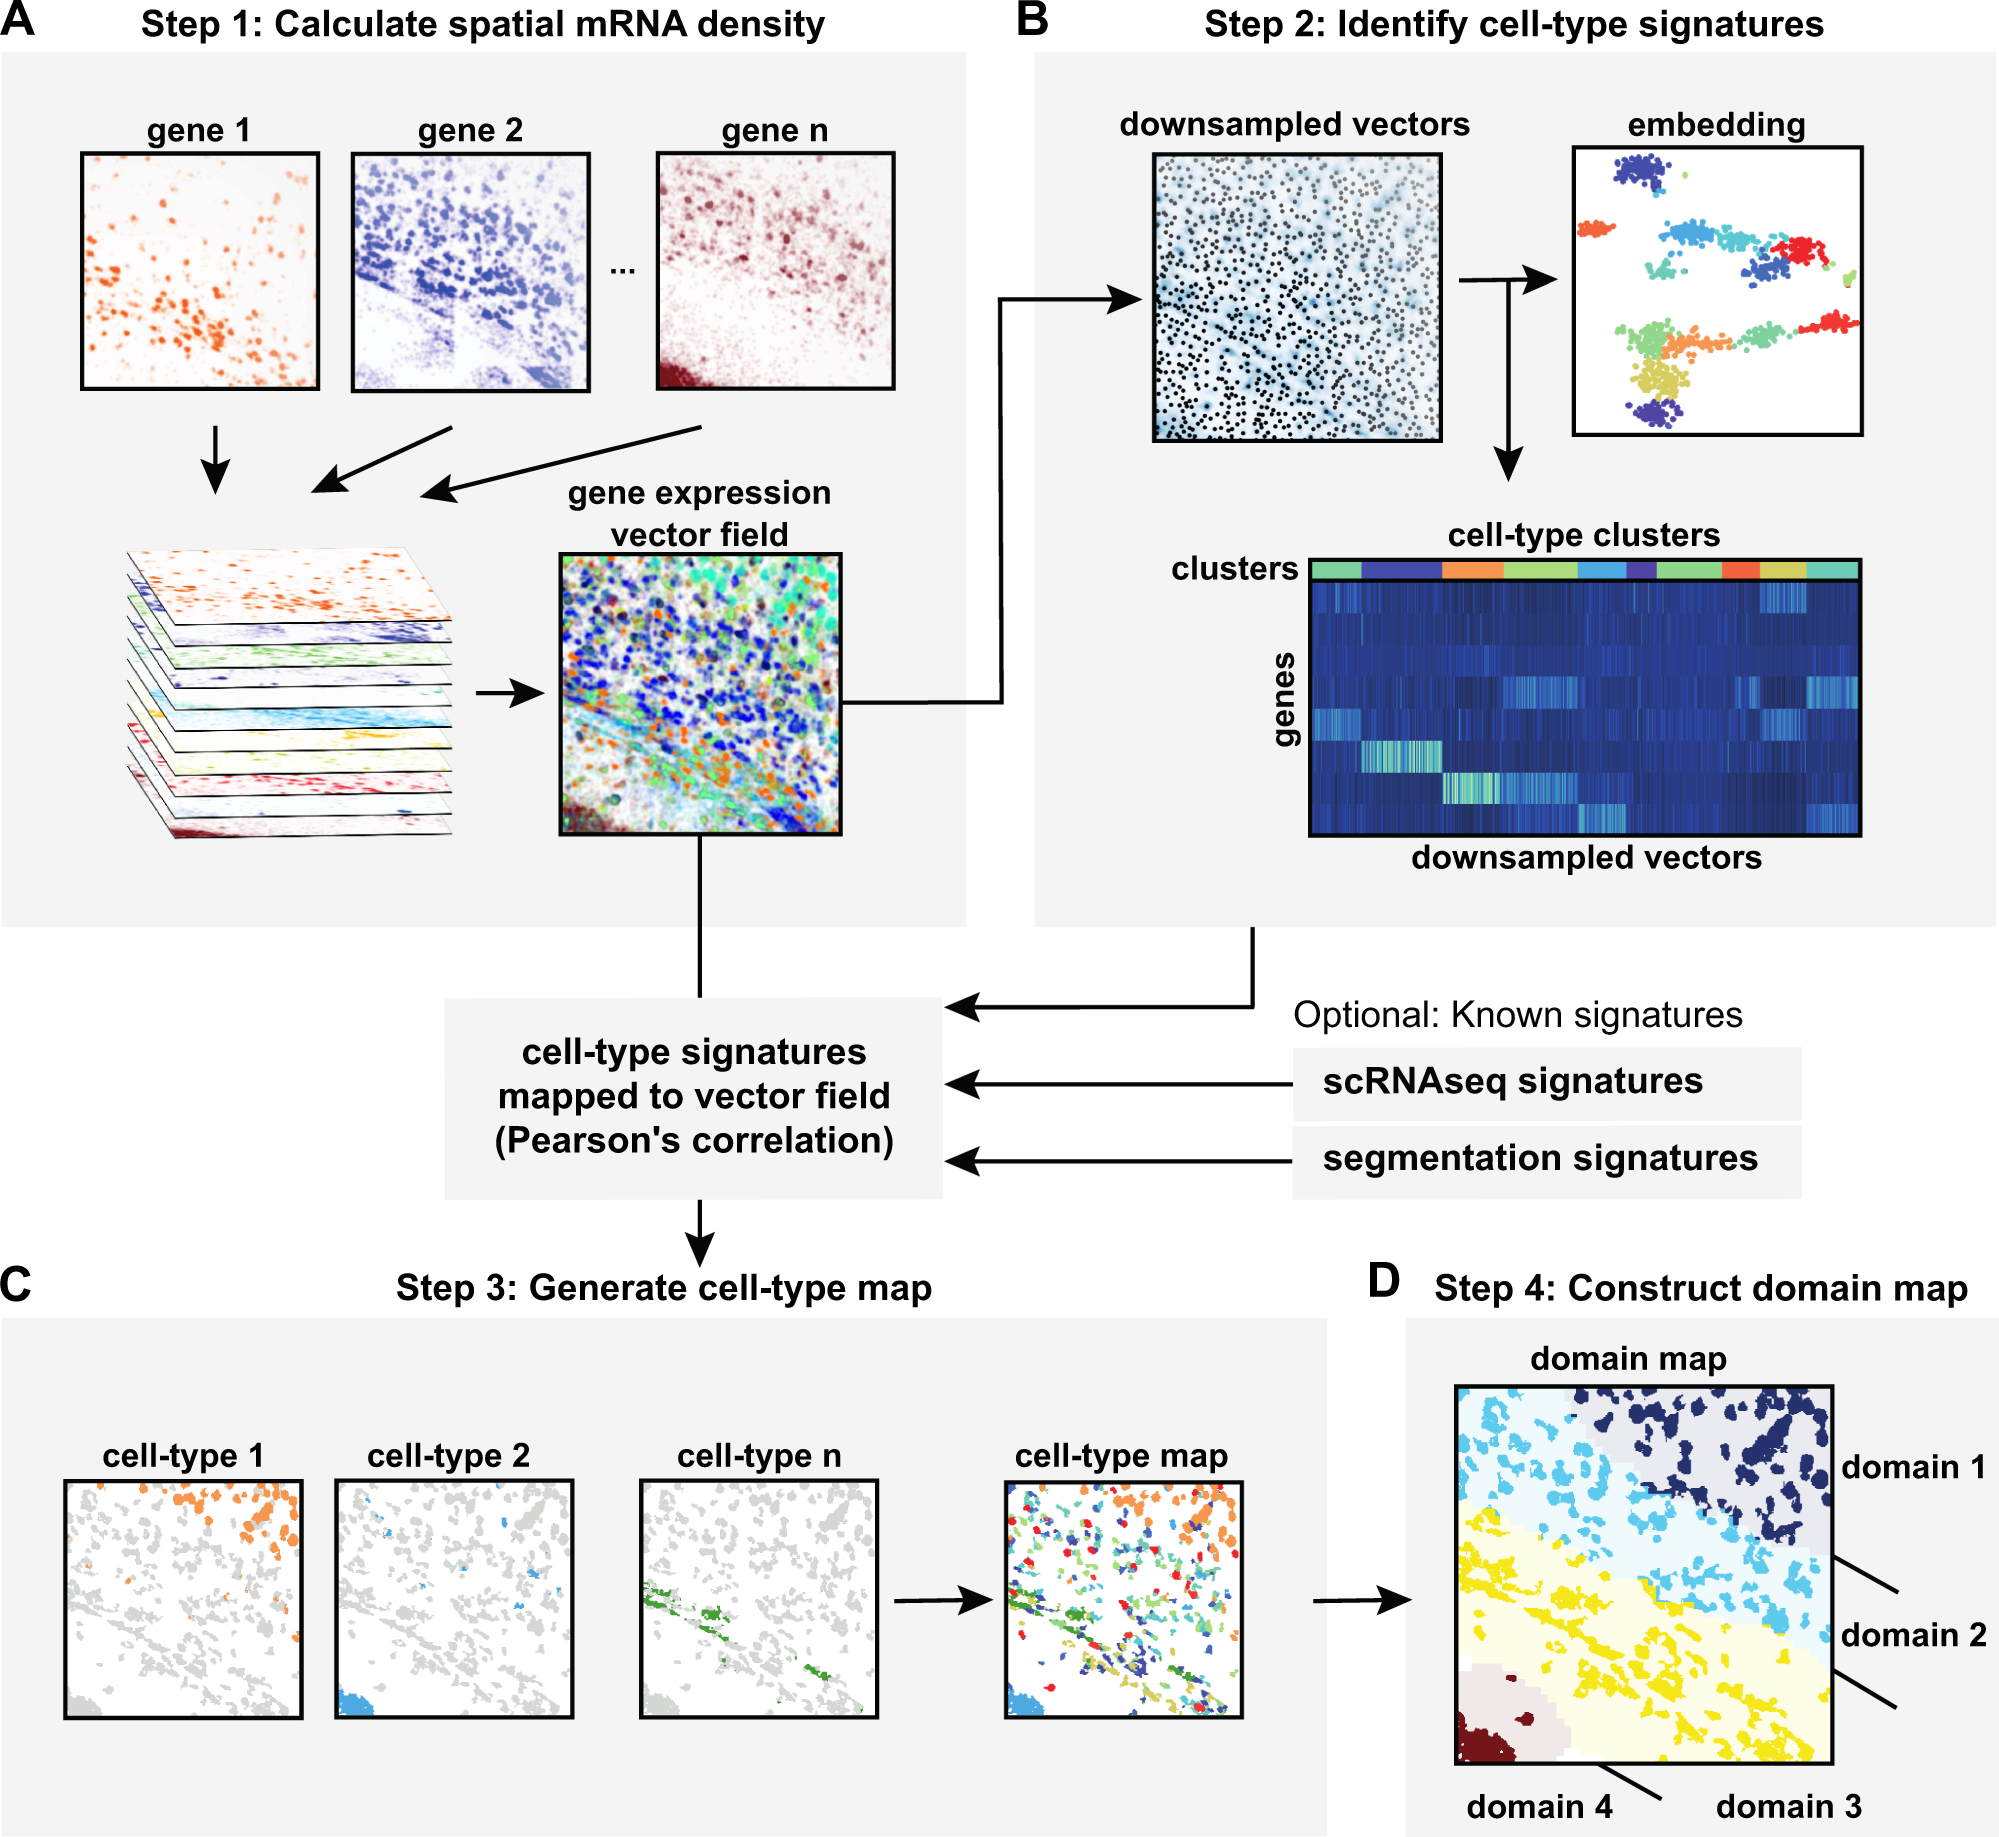
Fig. 1: Schematic diagram of the SSAM computational workflow for cell type and tissue domain definition based on gene expression data.
From: Cell segmentation-free inference of cell types from in situ transcriptomics data

A In step 1, SSAM converts mRNA locations into a vector field of gene expression values. For this, SSAM applies a Gaussian KDE to mRNA locations for each gene and projects the resulting mRNA density values to pixels that represents coordinates in the tissue. The mRNA density estimated per each gene is stacked to produce a ‘gene expression vector field’ over the image. The gene expression vector field is analogous to a 2D/3D image where each pixel/voxel encodes the averaged gene expression of the unit area. Further details of the application of KDE can be found in Supplementary Fig. 1A; B In step 2, cell-type signatures are identified de novo. First, the gene expression profile at probable cell locations is identified as the local regions in the gene expression vector field where the signal is highest. These downsampled gene expression signals are identified and used for de novo cell type identification by cluster analysis. Alternatively, previously defined cell-type signatures can be used. C In step 3, a cell-type map is generated. For this, the cell-type signatures are mapped onto the gene expression vector field and cell types are assigned based on Pearson’s correlation between each cell-type expression signature to the vector field to define cell-type distribution in situ. Further details about creating the cell-type map can be found in Supplementary Fig. 2A; D In step 4, the tissue domains are identified. The tissue domain signatures are identified using a sliding window to compute domain signatures based on the count of cell-type labels in the window. The tissue domains are defined by clustering these signatures. Further details on creating the tissue domain map can be found in Supplementary Fig. 2B.
