
Fig. 2: Comparison of major cell types across conditions.
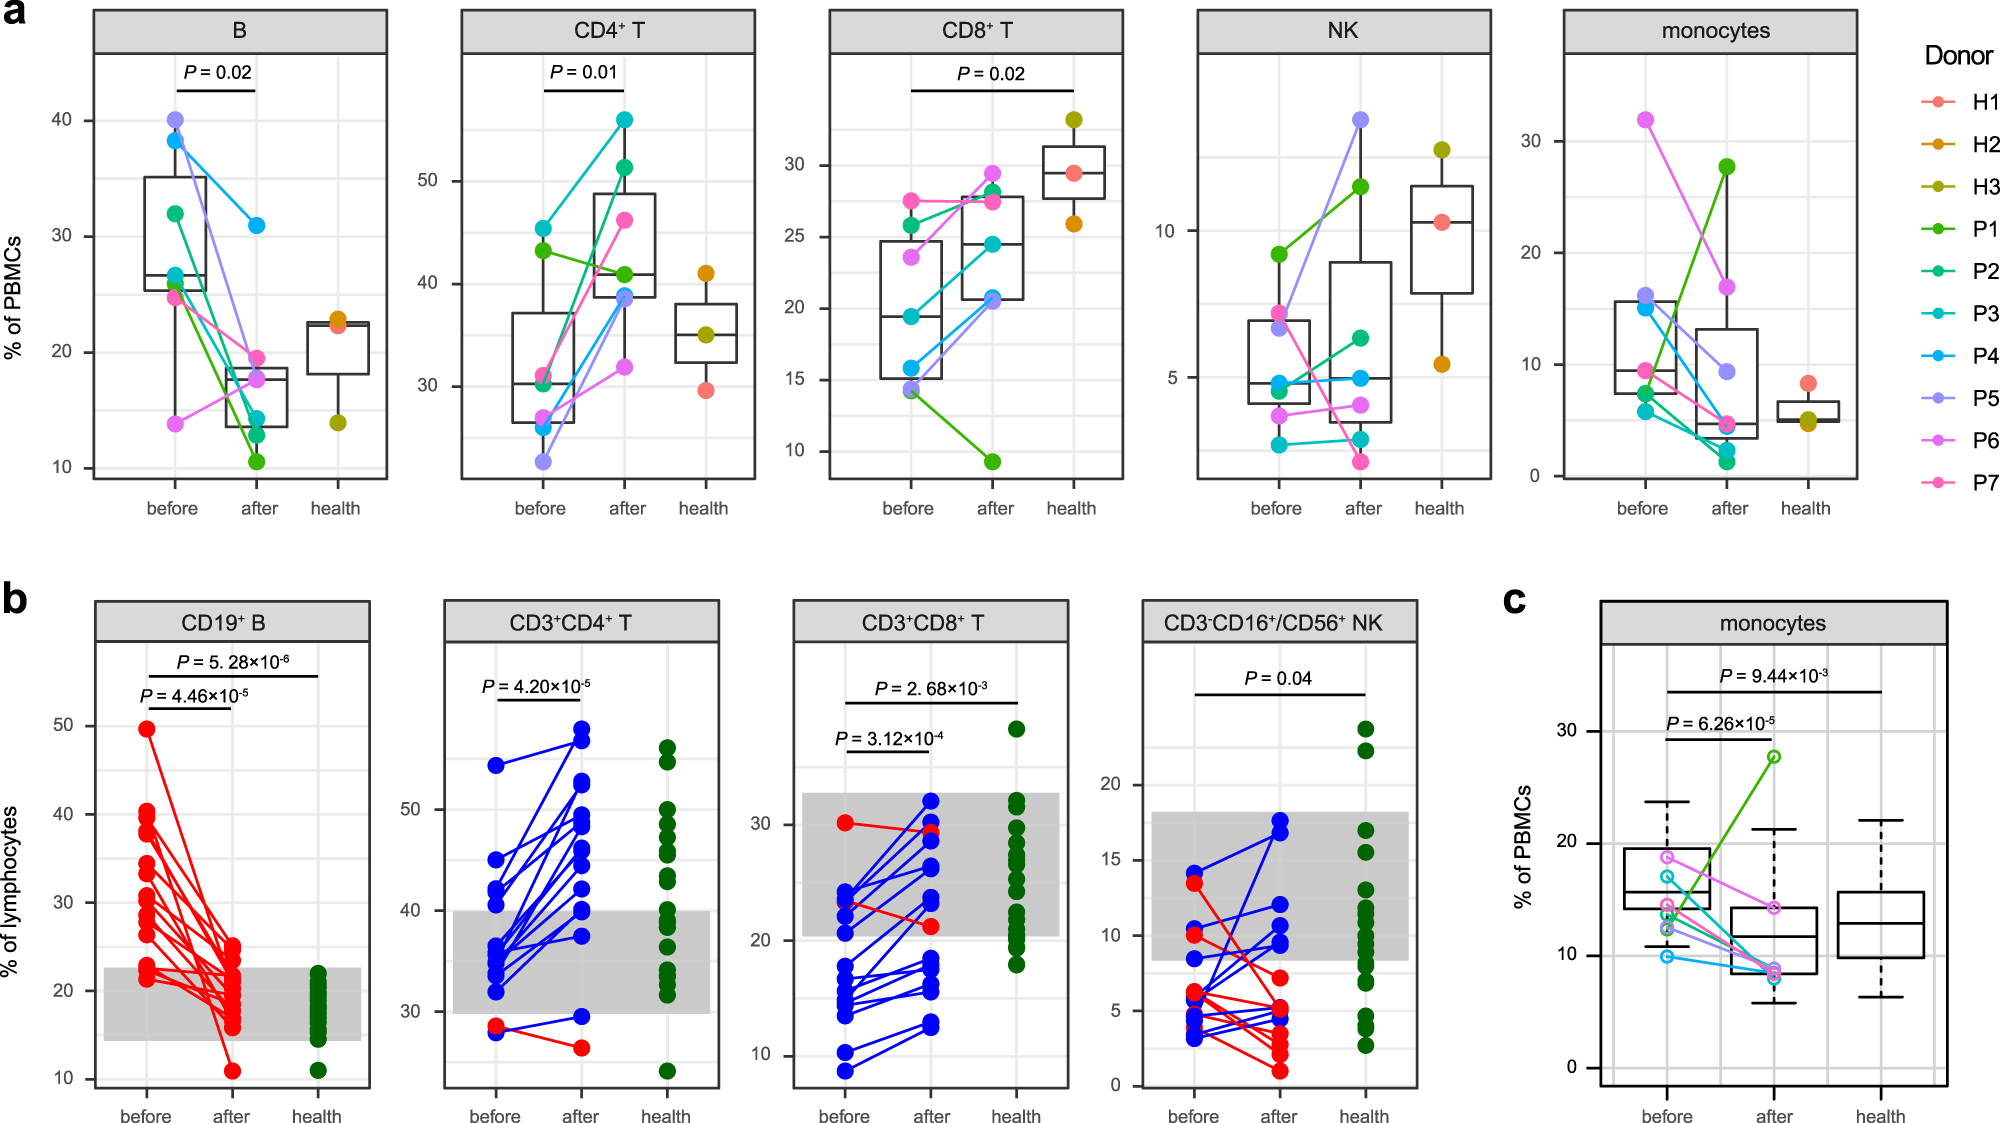
a Percentage of each cell type in PBMCs revealed by scRNA-seq. The samples are colored according to donors. P-values are calculated between pre- and post-treatment KD patients (n = 7) and healthy controls (n = 3) by using the two-sided t-test. b Percentage of lymphocyte populations by flow cytometric validation on additional KD patients (n = 16) and healthy controls (n = 20). Patients with a decreased percentage after therapy are colored in red, and patients with an increased percentage after therapy are in blue. Healthy controls are colored in green. The gray areas represent the reference ranges of the panel. P-values between conditions are calculated by using the two-sided t-test. c Percentage of monocytes by routine blood test of samples collected for both scRNA-seq (KD patients n = 7) and flow cytometric analysis (KD patients n = 16, healthy controls n = 20). KD patients for scRNA-seq are highlighted with the same color as (a). P-values are calculated by using the two-sided t-test. In (a) and (c), data are represented as boxplots where the middle line is the median, the lower and upper hinges correspond to the first and third quartiles, and the whiskers extend from the hinge to the farthest data point within a maximum of 1.5 × interquartile range. Source data are provided in the Source Data file.
