
Fig. 1: DNA damage increases RNA editing.
From: ADAR-mediated RNA editing of DNA:RNA hybrids is required for DNA double strand break repair
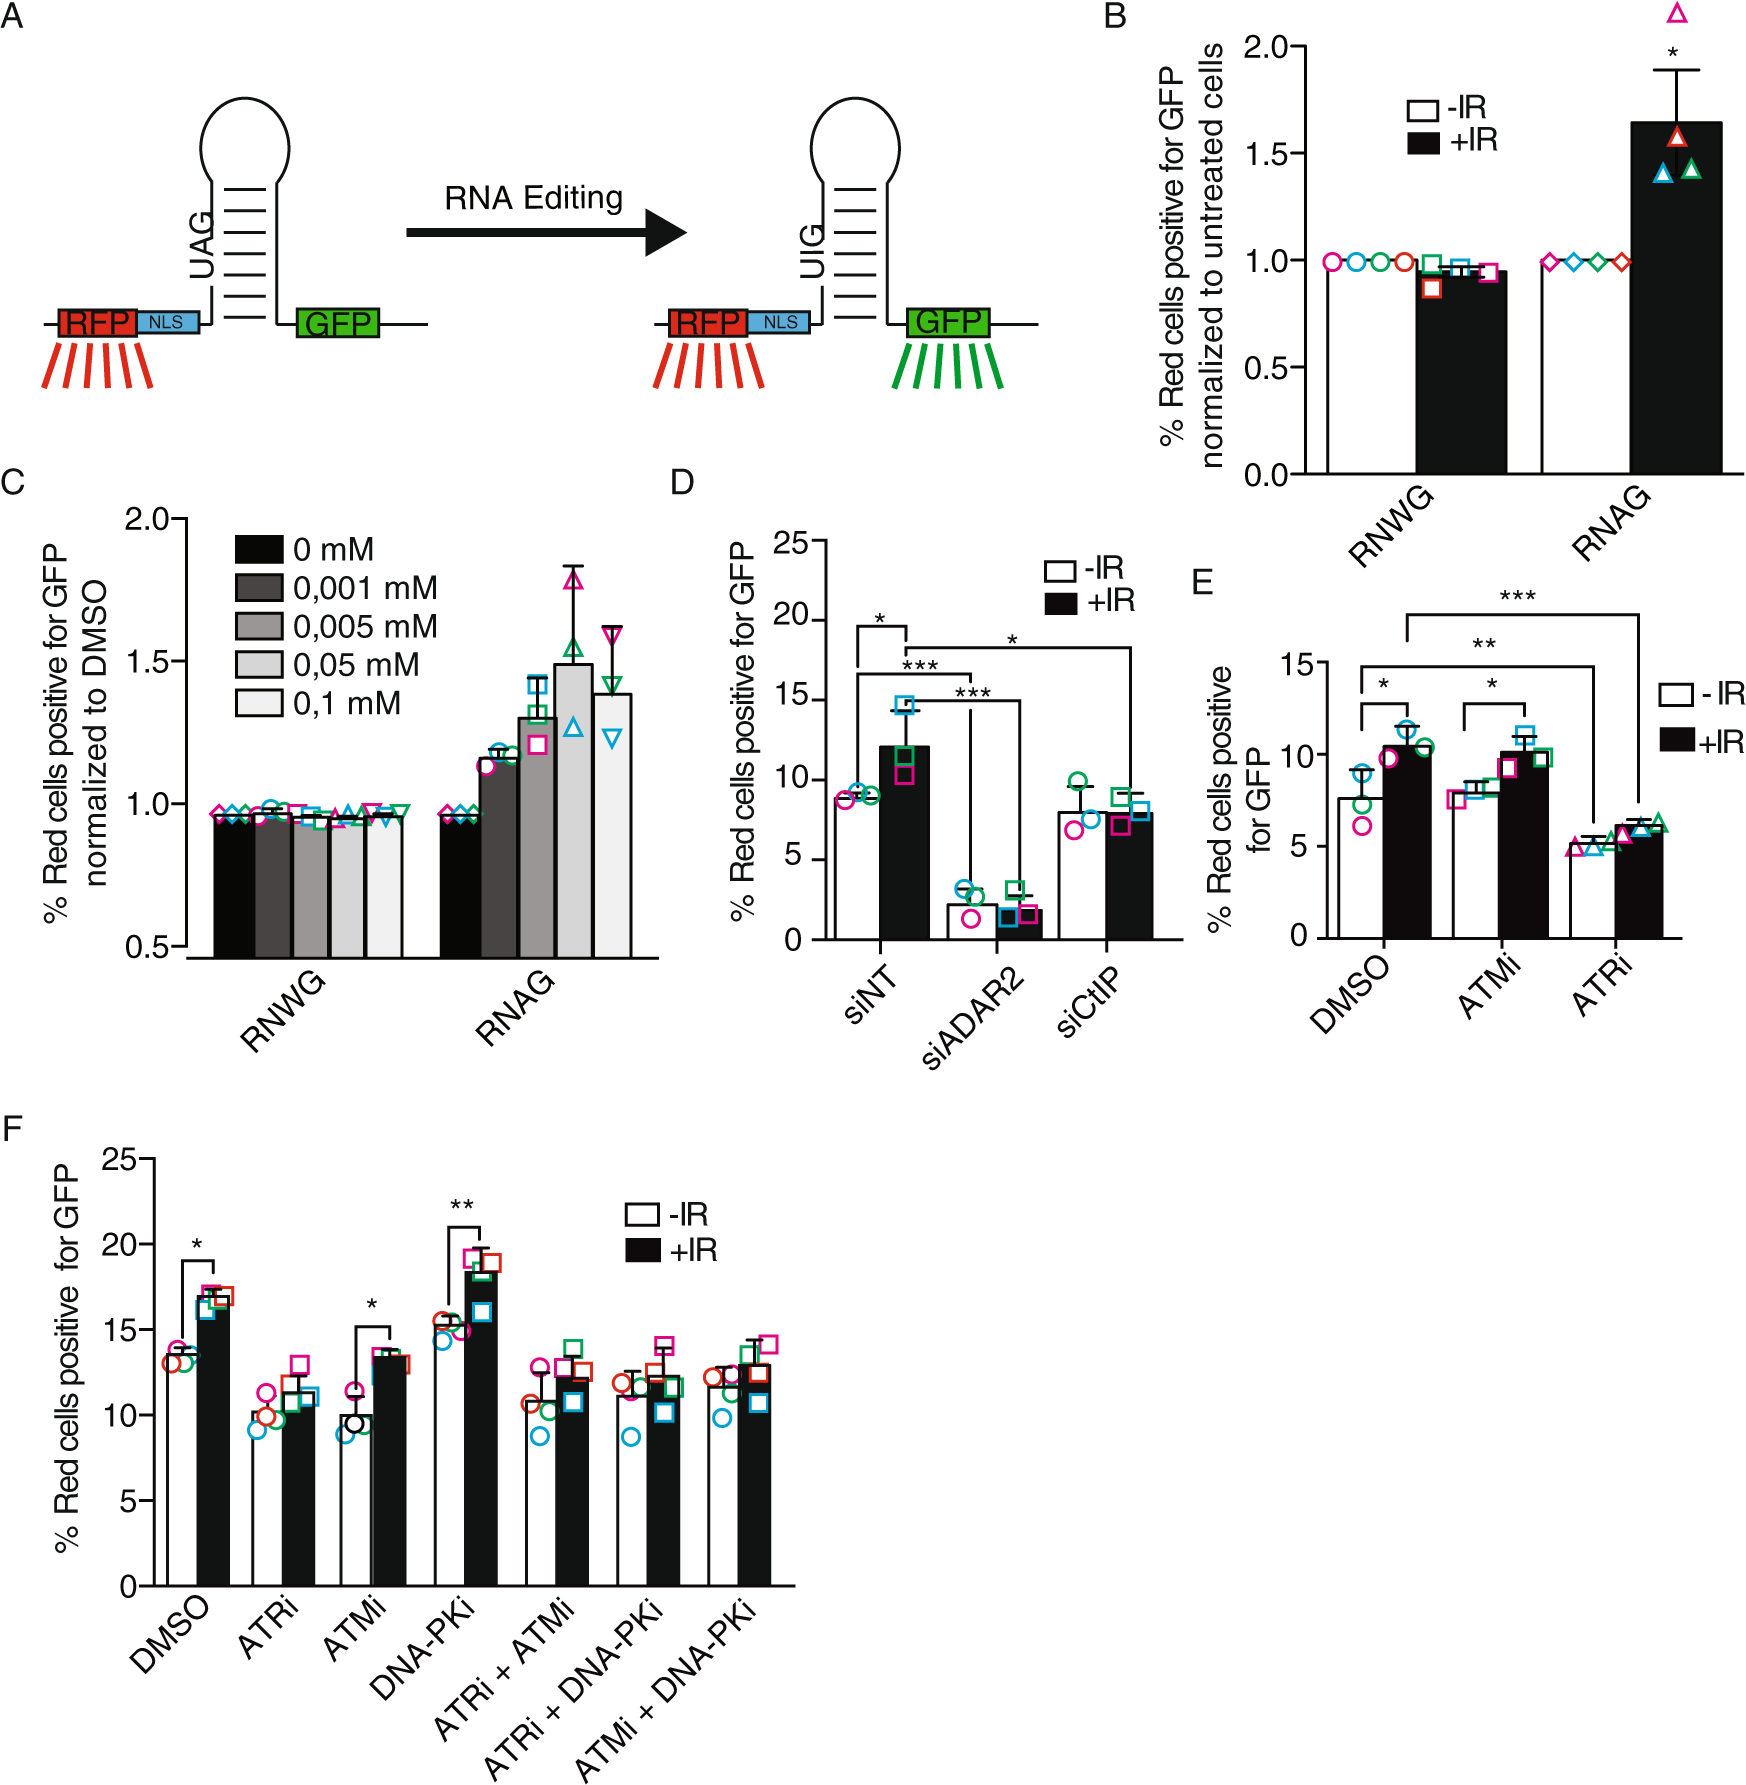
A Scheme of the RNAG editing system. A bi-cistronic mRNA containing the RFP and GFP sequences is produced. The presence of a stop codon impedes the expression of the GFP ORF, except when the adenine is edited to inosine. The presence of a secondary structure containing such stop codon allows its recognition and deamination of the adenine by ADAR proteins. B DNA damage-induced RNA editing. The plot shows the percentage of cells bearing the RNAG reporter or the constitutively edited RNWG system that express both the RFP (red cells) and GFP (green cells). Cells were either irradiated (+IR; 10 Gy; black bars) or mock-treated (–IR; white bars) and incubated for 12 h. The percentage of green cells over 10.000 red cells were analyzed on BD FACSAriaTM using FACSDiva v5.0.3 software. For each reporter, the ratio of green and red cells was normalized with the untreated conditions. Statistical significance was determined with a two-tailed paired Student’s t-test. C Same as B, but cells were treated with the indicated concentration of camptothecin (CPT). D Cells bearing the RNAG reporter were transfected with the indicated siRNAs and irradiated or not, and the percentage of red cells that were also green is plotted. Statistical significance was determined with a two-way ANOVA. E Same as D, but cells were pretreated for 2 h with 10 μM of inhibitors of ATM (ATMi), ATR (ATRi), or DMSO as control, previous to the irradiation. Cells were collected to check for editing levels 10 h after irradiation. The inhibitors were kept for the duration of the experiment. Statistical significance was determined with a two-way ANOVA. F Same as E, but, cells were also treated with DNA–PK inhibitor (DNA–PKi), as well as the double combinations of the ATM, ATR, and DNA–PK inhibitors, as indicated. Statistical significance was determined with a two-way ANOVA. The average and the standard deviation of the medians of four (panels B and F) or three (panels C–E) independent experiments are shown. Each individual replica is marked with a colored symbol. One, two, or three asterisks represent p < 0.05, p < 0.01, or p < 0.001, respectively. Actual p-values can be found in the Source data file. Only biological relevant comparisons are shown.
