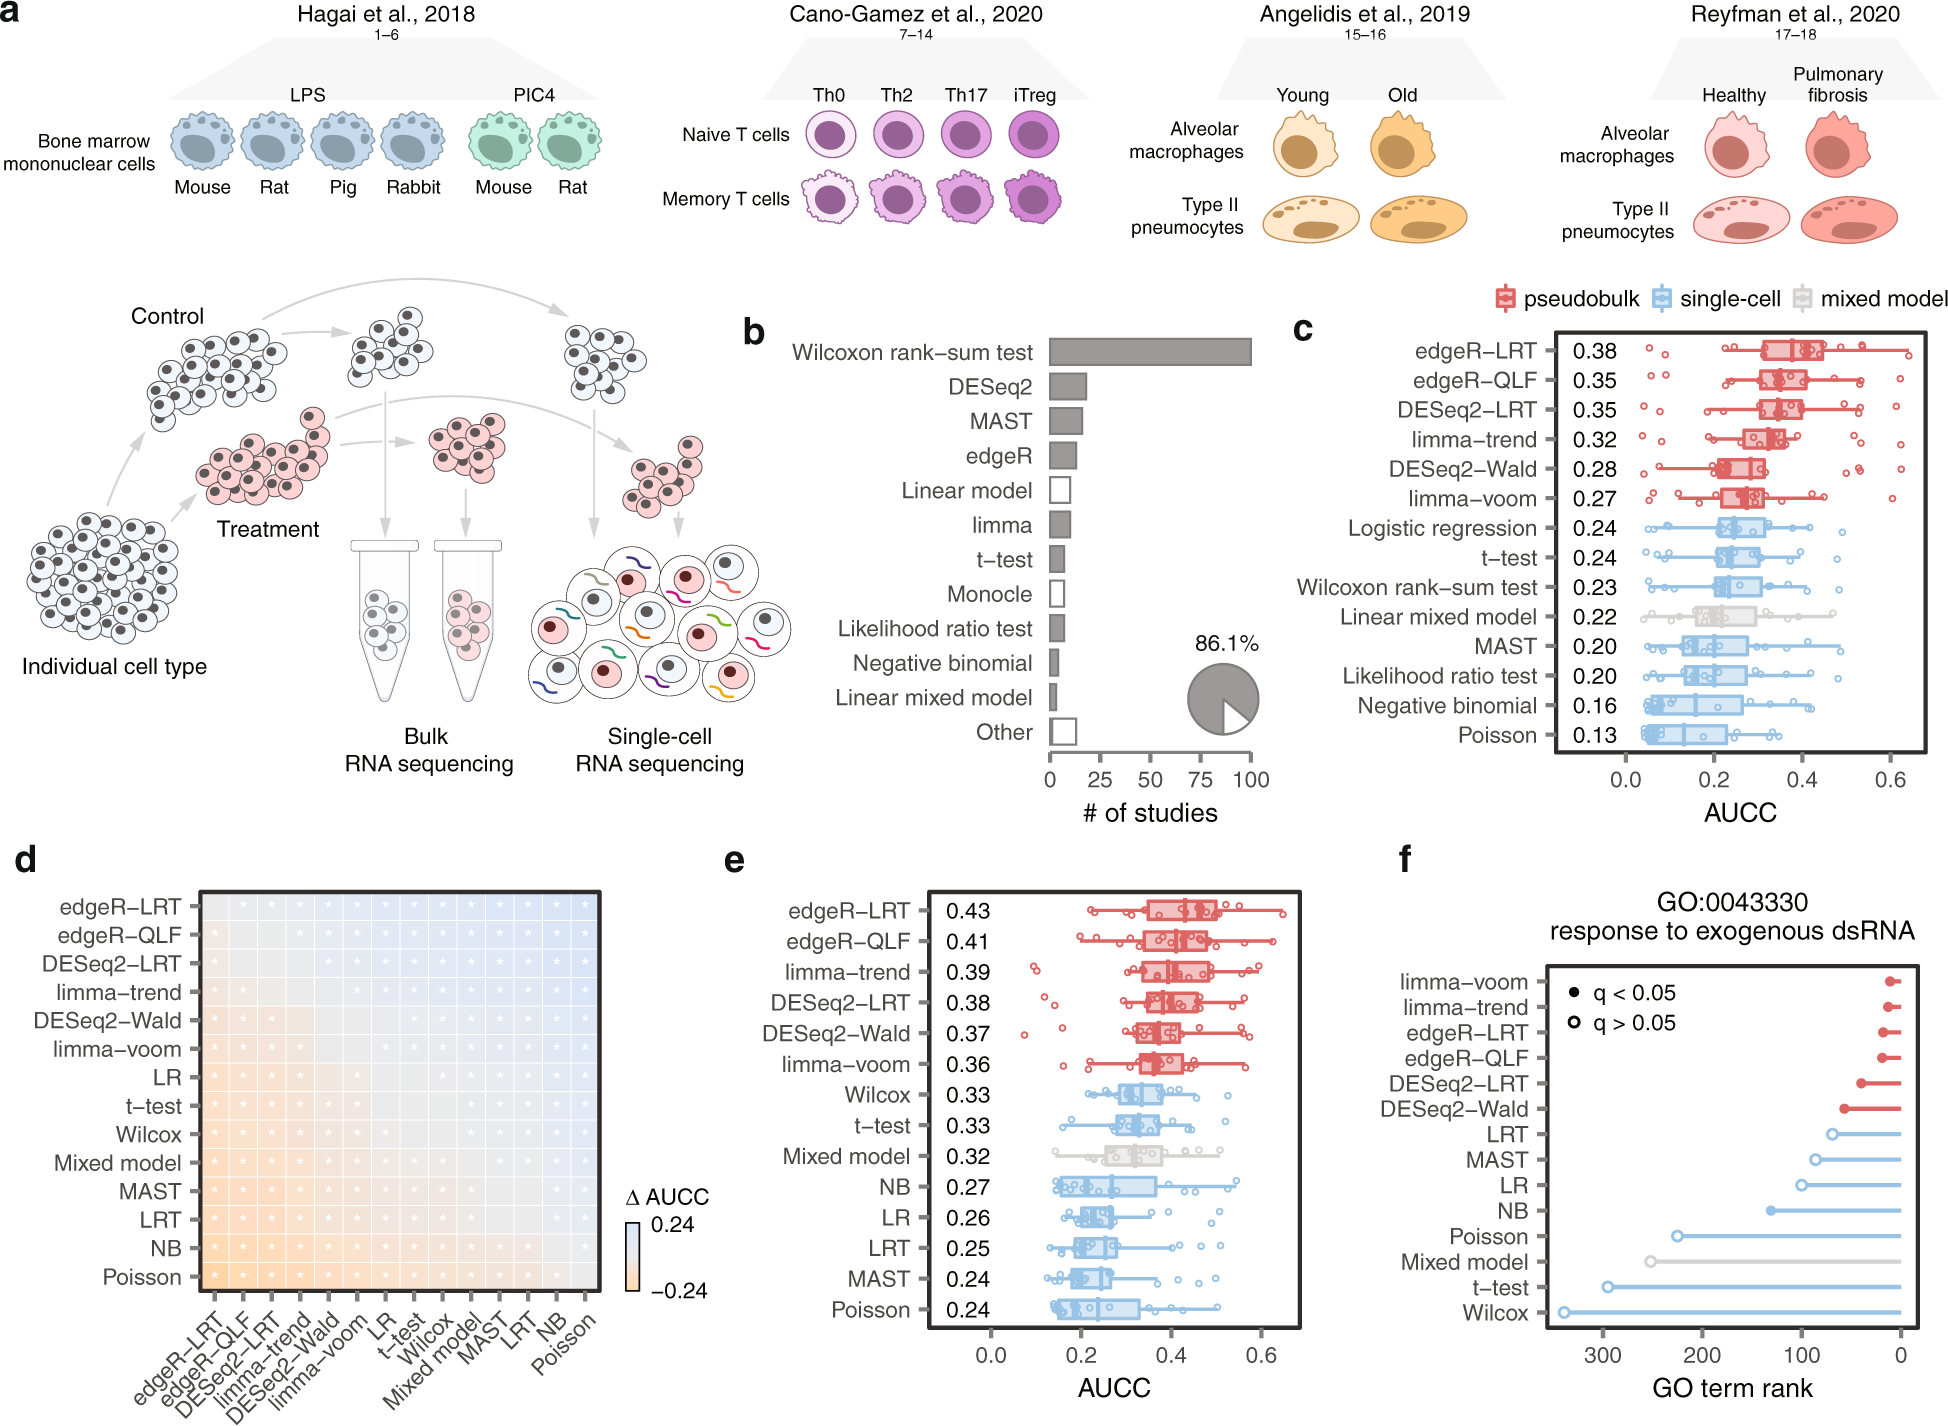
Fig. 1: A systematic benchmark of differential expression in single-cell transcriptomics.
From: Confronting false discoveries in single-cell differential expression

a Schematic overview of the eighteen ground-truth datasets analyzed in this study. b Statistical methods for DE analysis employed in 500 recent scRNA-seq papers. Grey bars represent DE analysis methods included in this study. “Other” includes methods used in two or fewer studies. Inset pie chart shows the total proportion of recent scRNA-seq papers that employed DE analysis methods included in this study. Source data are provided as a Source Data file. c Area under the concordance curve (AUCC) for fourteen DE methods in the eighteen ground-truth datasets shown in a. d Mean difference in the AUCC (∆ AUCC) between the fourteen DE methods shown in c. Asterisks indicate comparisons with a two-tailed t-test p-value less than 0.05. e AUCC of GO term enrichment, as evaluated using gene set enrichment analysis46, in the eighteen ground-truth datasets shown in a. f Rank and statistical significance of the GO term GO:0043330 (“response to exogenous dsRNA”) in GSEA analyses of mouse bone marrow mononuclear cells stimulated with poly-I:C, a type of synthetic dsRNA, for four h, using the output of fourteen DE methods. Source data are provided as a Source Data file.
