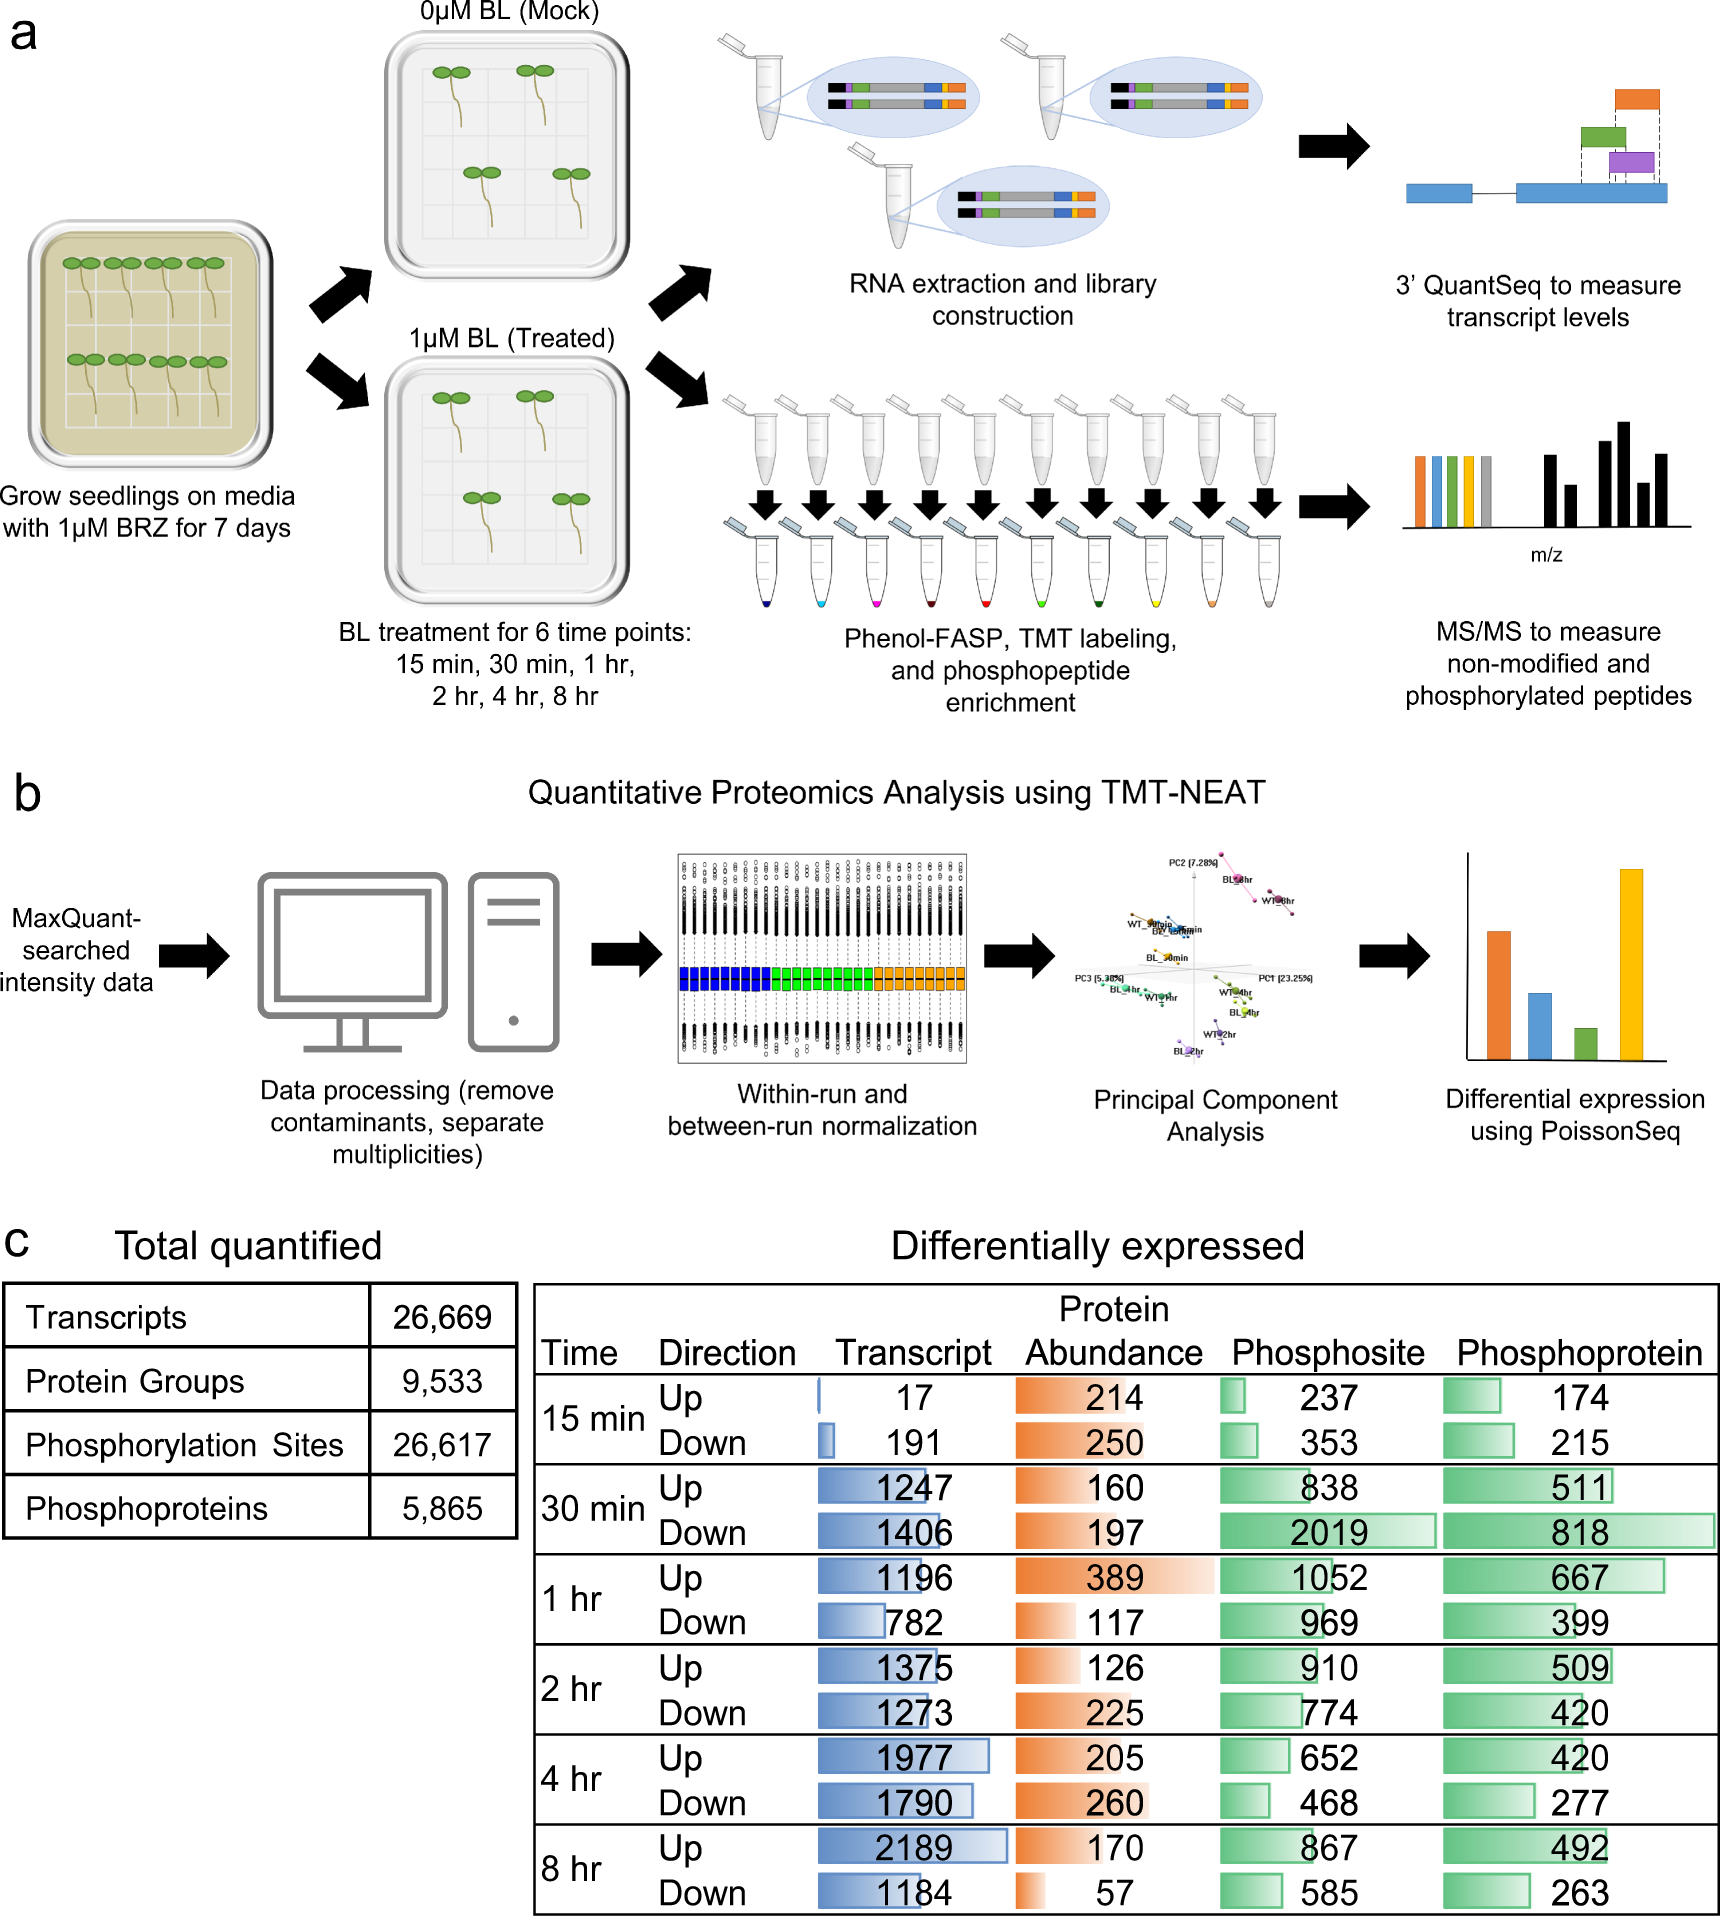
Fig. 1: An integrated omics time course of BR response.

a Samples were collected at six timepoints (15 min, 30 min, 1 h, 2 h, 4 h, 8 h) from Mock and BL-treated seedlings. b TMT-NEAT analysis pipeline for quantitative proteomics. c (left) Total number of transcripts, proteins, and phosphosites/phosphoproteins quantified at each time point. (right) The number of DE transcript, proteins, and phosphosites/phosphoproteins at each time point. Colored bars represent the relative number of DE gene products within each data type.
