
Fig. 2: Temporal trends in river discharge during 1984–2018.
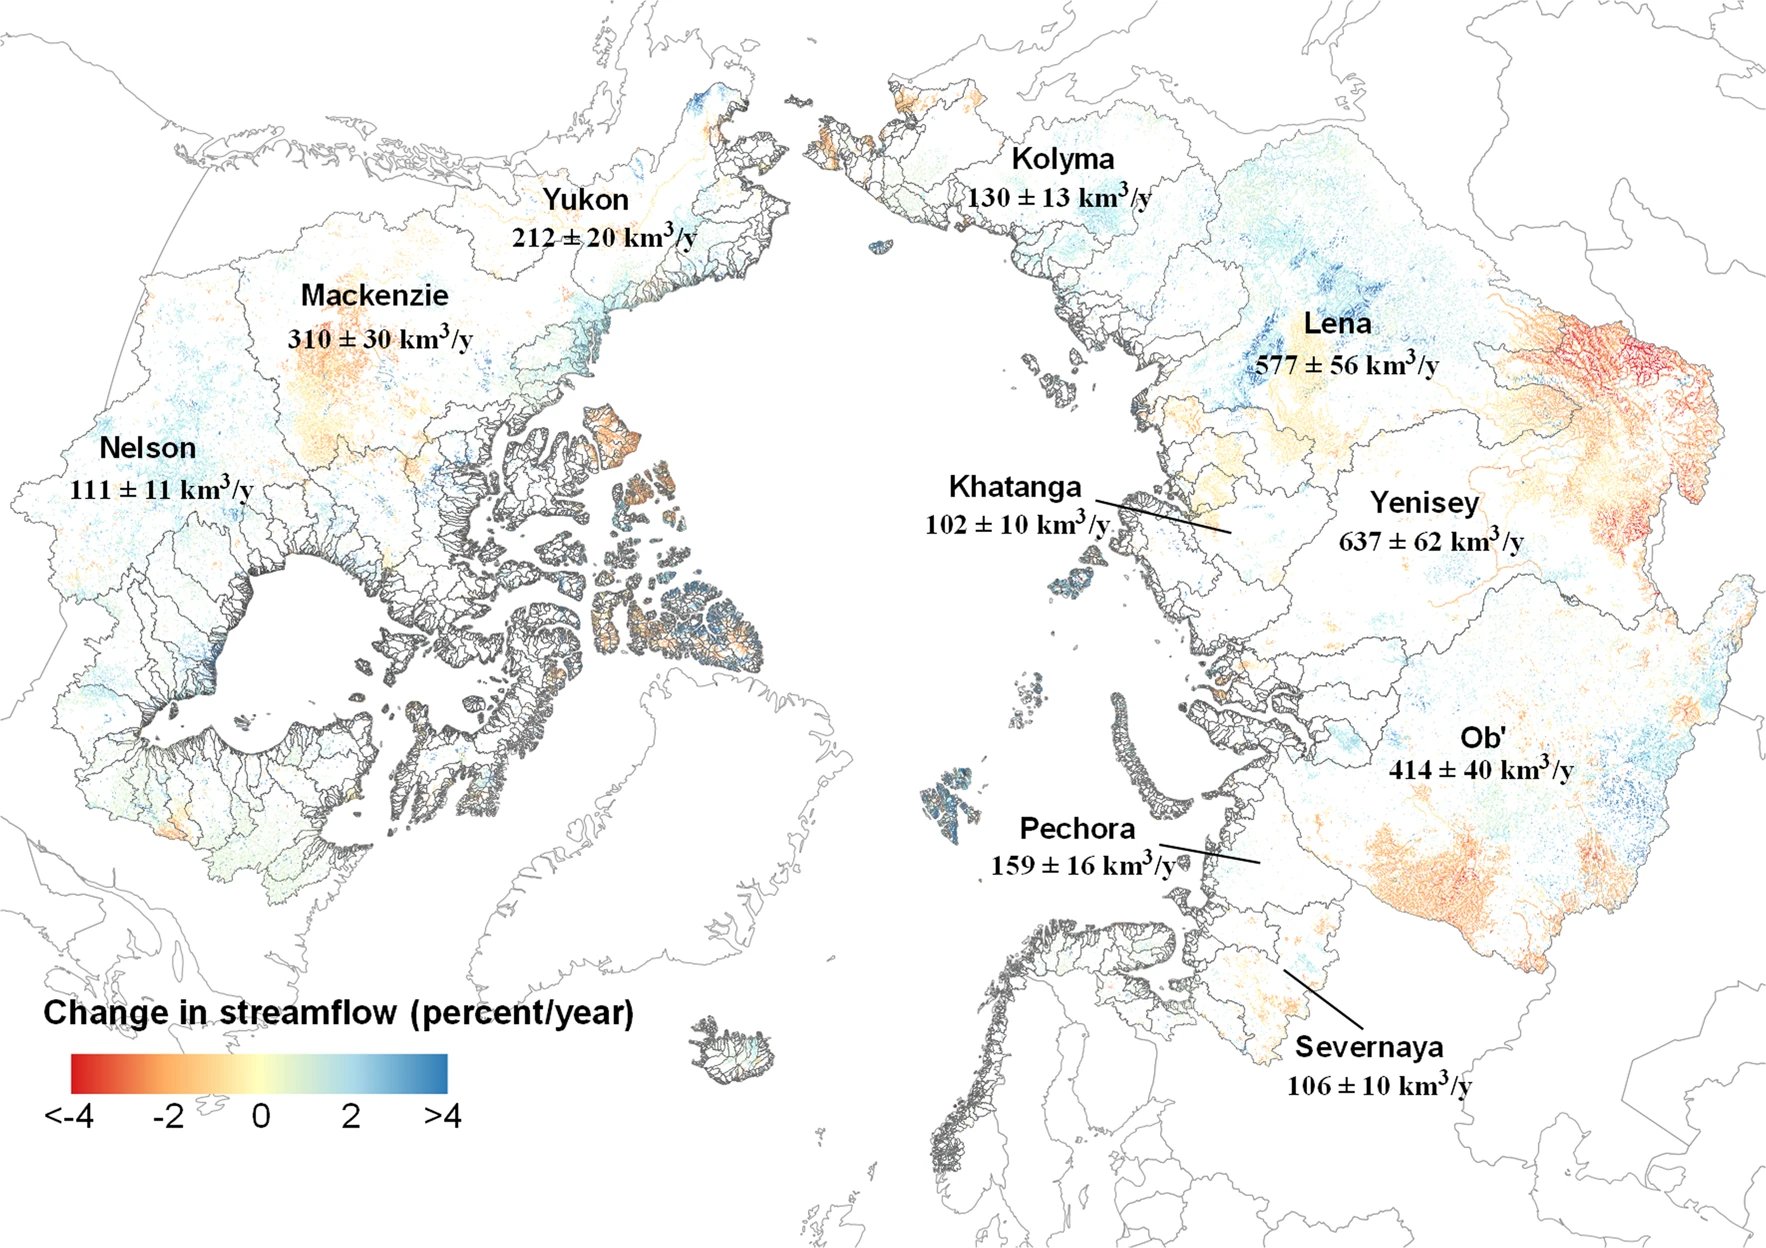
Arctic rivers show substantial spatial variations in discharge trends. Only rivers with statistically significant trends are mapped (percent/year, p-value<0.05). Trend significance is calculated using the pre-whitening Mann–Kendall test. The mean annual discharge (km3/y) is labeled for ten major river basins (see more details about its change in Supplementary Table 2).
