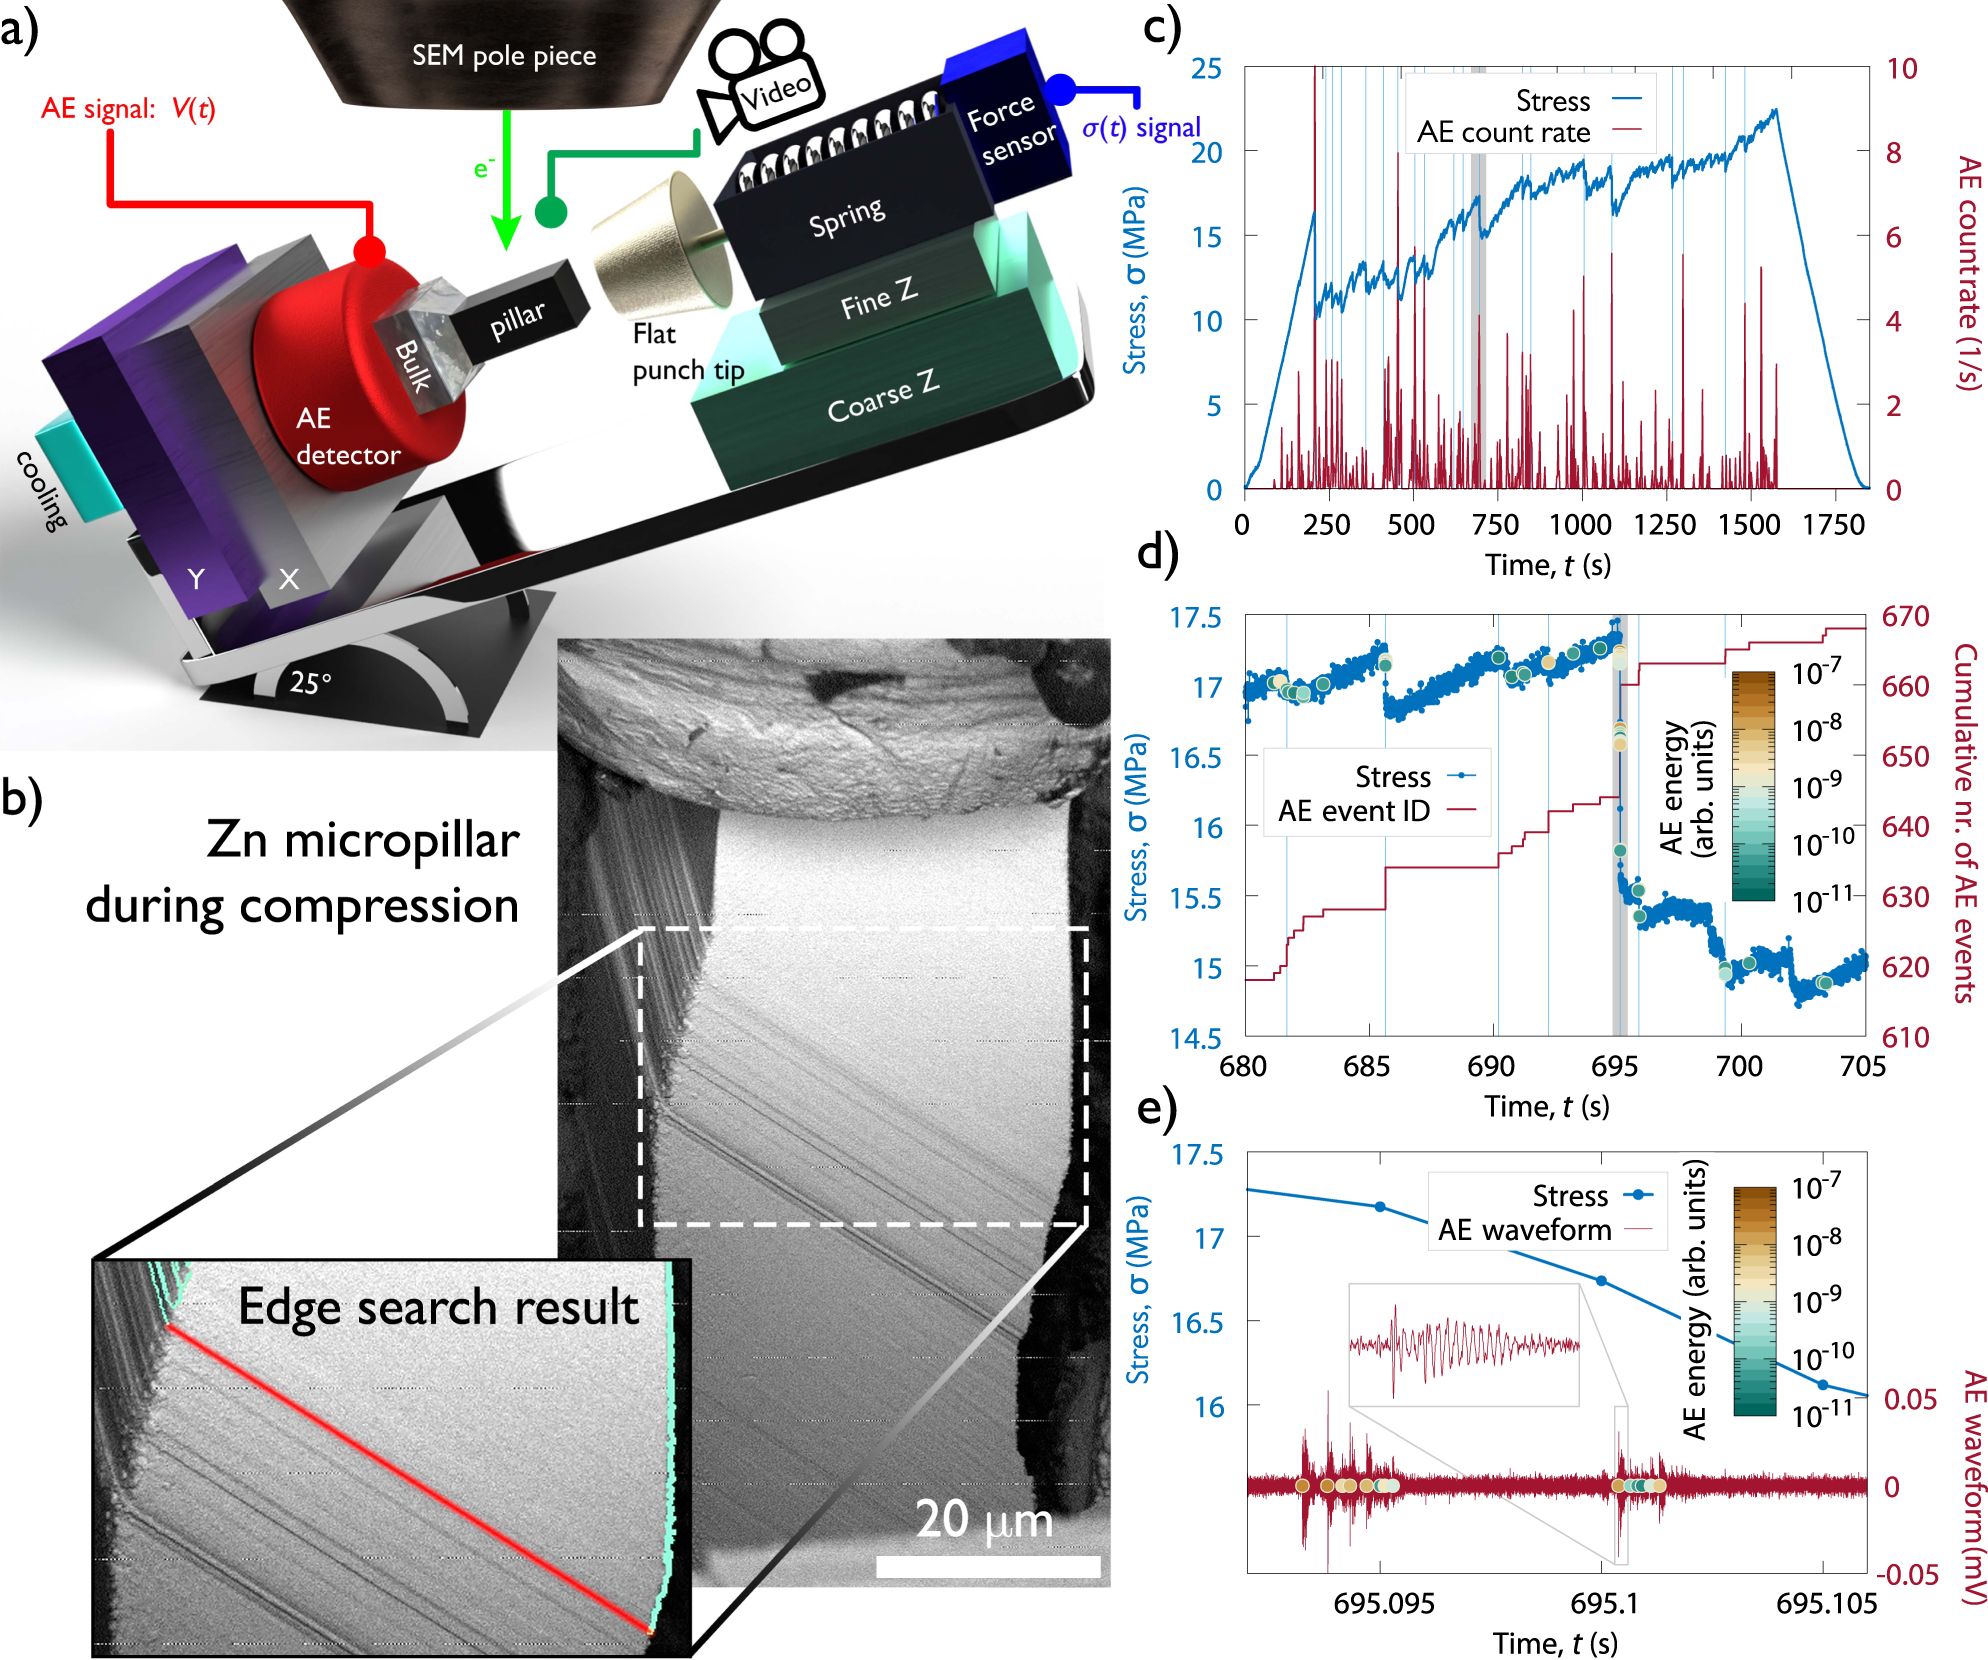
Fig. 1: Compression experiment of Zn micropillars oriented for single slip.
From: Dislocation avalanches are like earthquakes on the micron scale

a Sketch of the experimental set-up with a disproportionately large micropillar for clarity. b Backscattered electron image of a d = 32 μm micropillar during compression. The magnified image shows the slip band in red corresponding to the stress drop highlighted in grey in panels (c) and (d). The location of the band was obtained by edge search on SEM images before and after the stress drop. c Measured stress vs. time as well as the averaged rate (obtained by convolution with a Gaussian of 0.5 s width) of the detected individual AE bursts. The light blue vertical lines mark the stress drops larger than 1 MPa. d Zoomed stress-time curve of the region shaded by grey in panel (c). The coloured data points along the stress curve represent the individual AE events and their energies, whereas the red curve shows the cumulative number of these events. The light blue vertical lines mark short periods with at least two AE events. e Zoomed stress-time curve of the region shaded in grey in panel (d) and the detected AE waveform of the same interval. The inset shows the magnified view of a single event and coloured data points correspond to individual signals detected by thresholding the AE signal.
