
Fig. 2: Measured intensity distributions of photonic spin-multiplexed metalens arrays.
From: Trilobite-inspired neural nanophotonic light-field camera with extreme depth-of-field
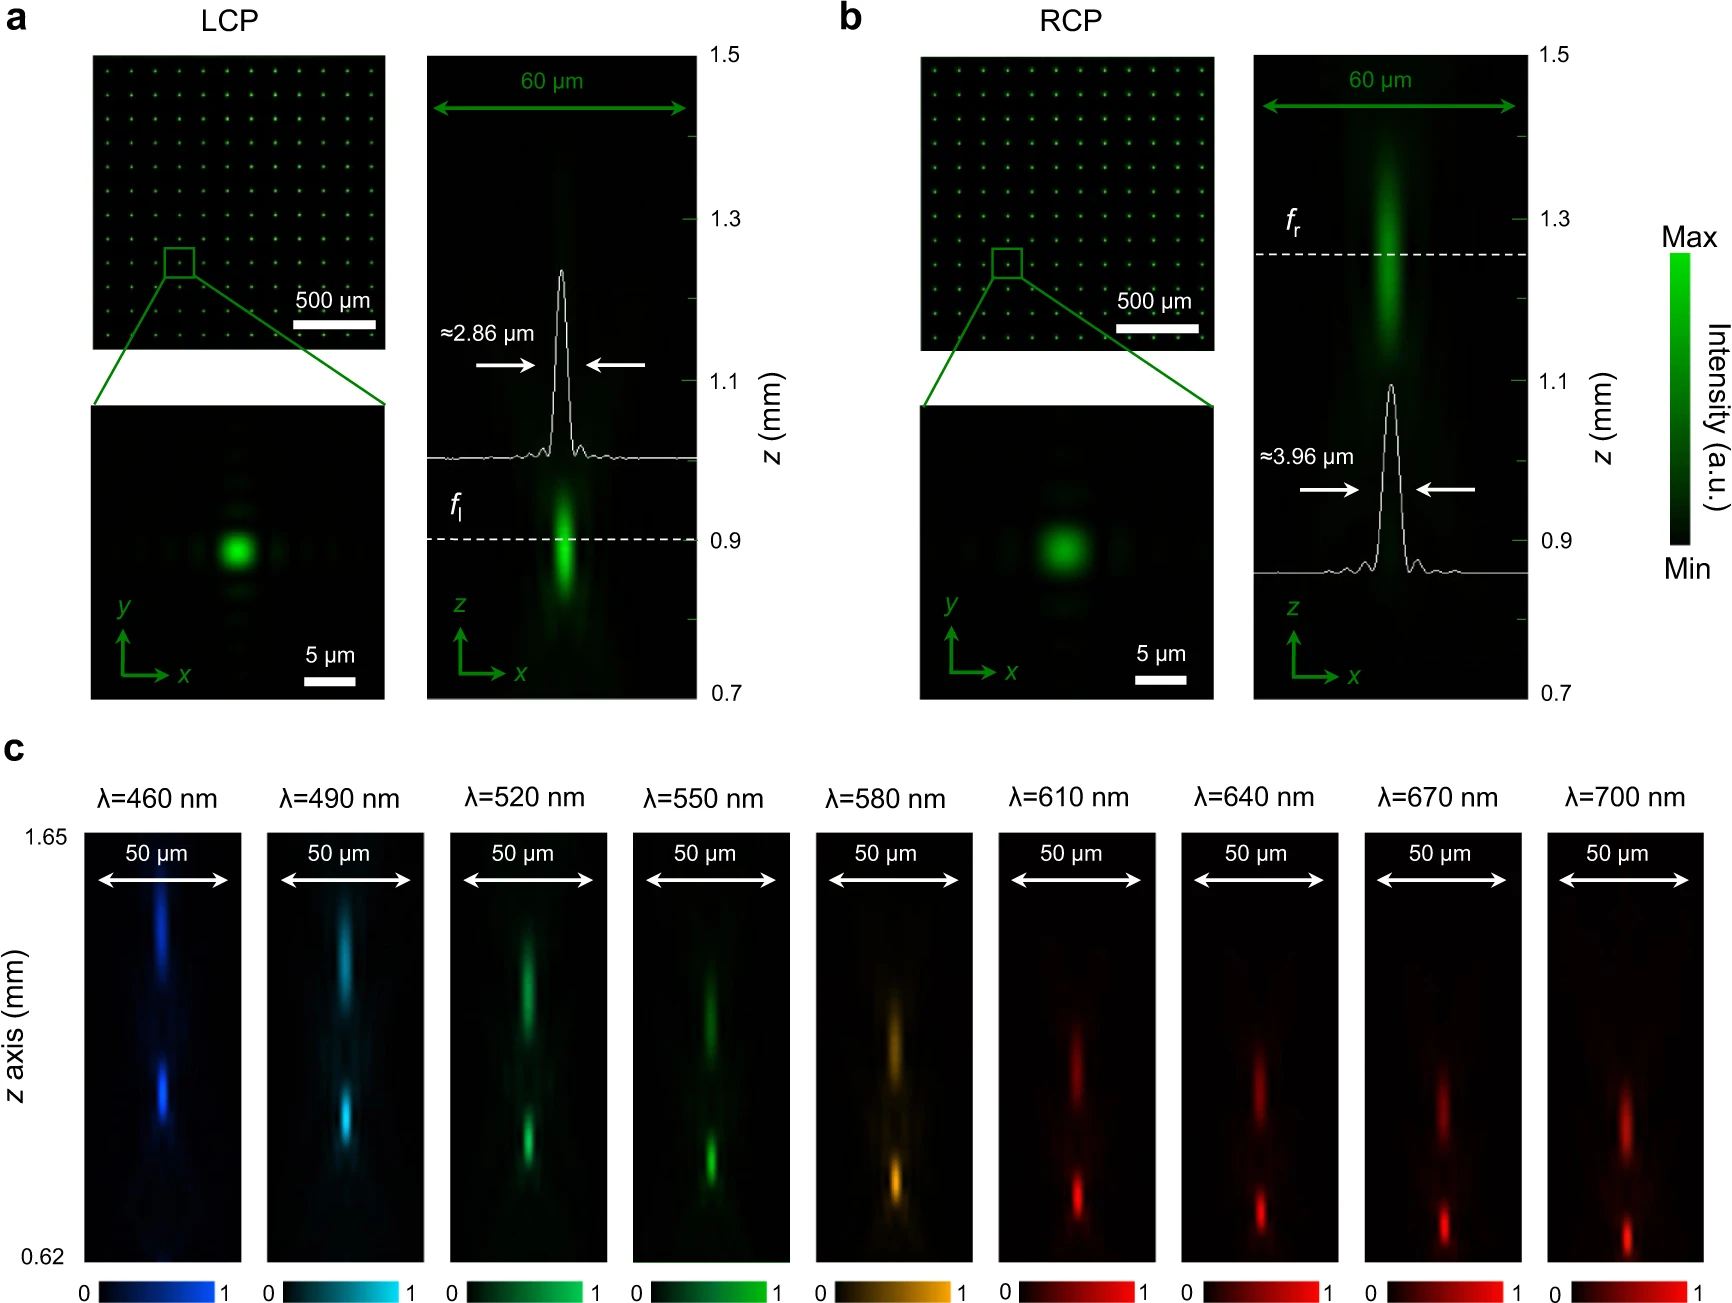
Focal spots in the \(x\)-\(y\) and \(x\)-\(z\) plane for (a) LCP and (b) RCP incident light at the wavelength of 530 nm. For ease-of-viewing, here we show an array of 12 × 12 focal spots (top left). The solid white lines show the horizontal cuts of the intensity distributions of focal spots. c Dispersion of a single submetalens illustrated by metalens focusing at different focal lengths for the wavelength spanning from 460 nm to 700 nm. The incident light is linearly polarized.
