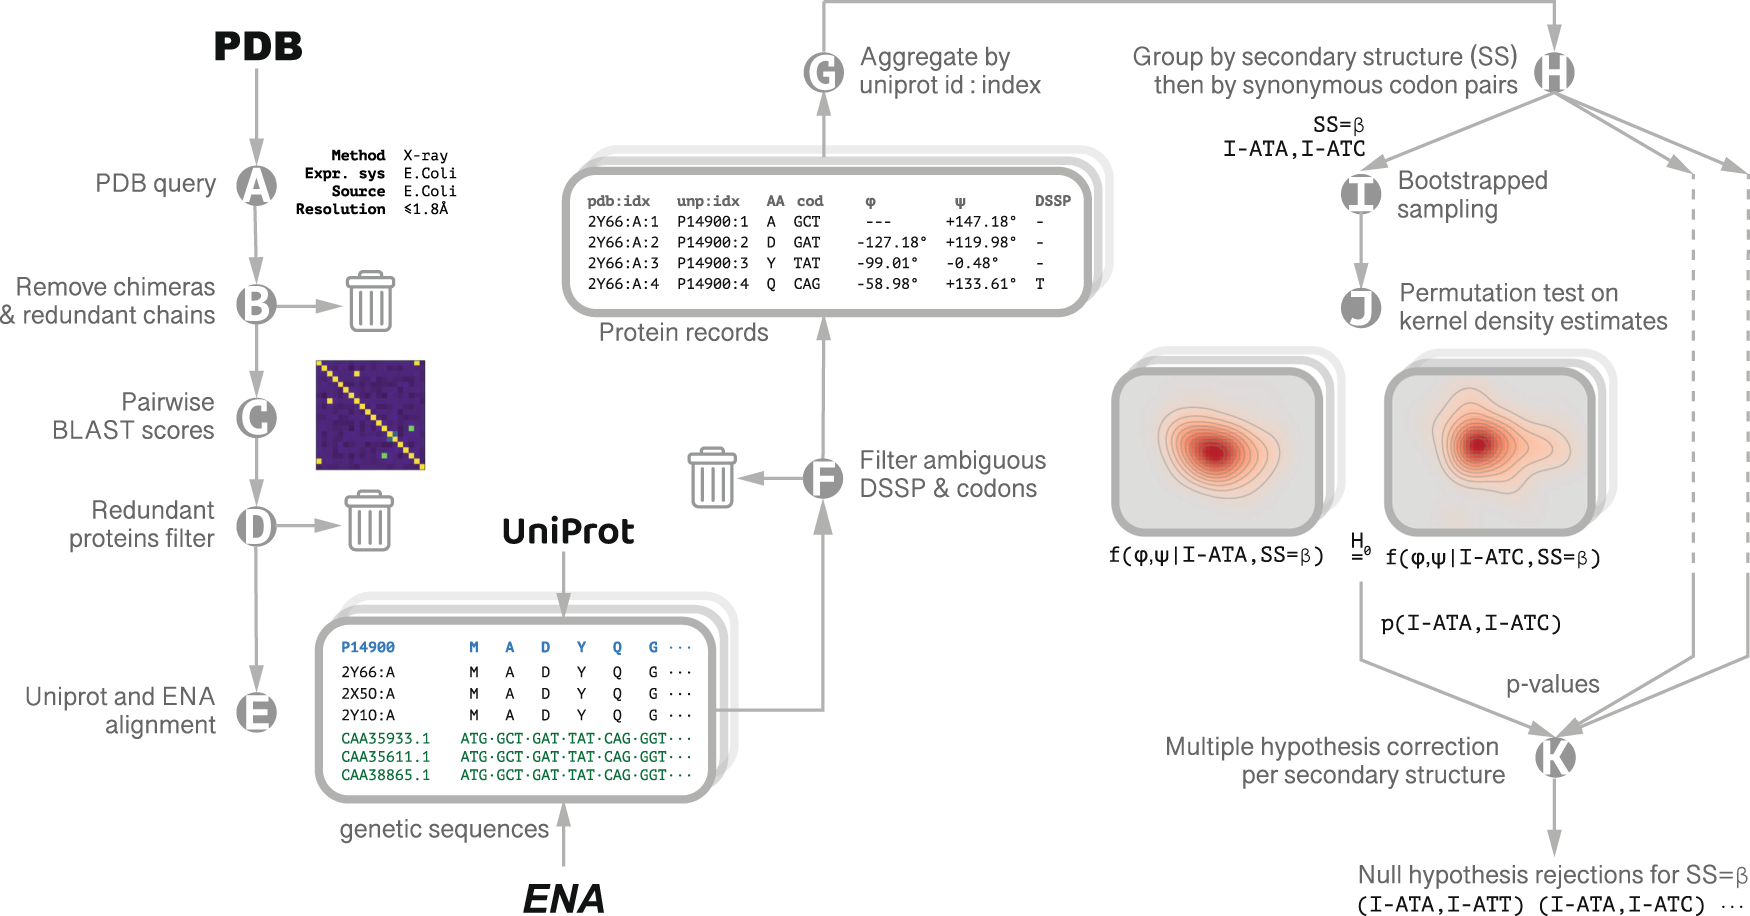
Fig. 1: Data Collection and Analysis.

Querying the PDB for high resolution (≤1.8 Å), high quality (Rfree ≤ 24%) X-ray crystal structures of E. coli proteins expressed in E. coli (A), out of which unique chains were extracted (B). To ensure the protein set was non-redundant, pairwise sequence alignment scores were calculated between every pair of unique sequences (C). A farthest point sampling procedure was then employed to produce a sub-set of structures with normalized pairwise similarity not exceeding 0.7 (D). Structures were then grouped according to their unique Uniprot identifier. Genetic sequences were retrieved from ENA records cross-referenced by Uniprot (E), adopting a conservative approach: locations having more than one genetic variant for a specific residue are excluded from further analysis (F). For each group, a single protein record was generated with each point in the amino acid sequence annotated with the φ, ψ backbone dihedral angles averaged over all the structures in the record, the codon, and DSSP secondary structure assignment (G). The final data set included 1343 protein chains. We estimated the codon distributions from their samples using kernel density estimation (KDE) on a torus with a Gaussian kernel width of 2°. We used a bootstrap-resampling scheme to estimate multiple realizations of these codon specific distributions. p-values were calculated via permutation test on the L1 distance between the estimated densities (steps H–J); the rejection threshold (p = 0.019) was established by Benjamini-Hochberg multiple hypothesis correction with the false discovery rate set to q = 0.05 (K).
