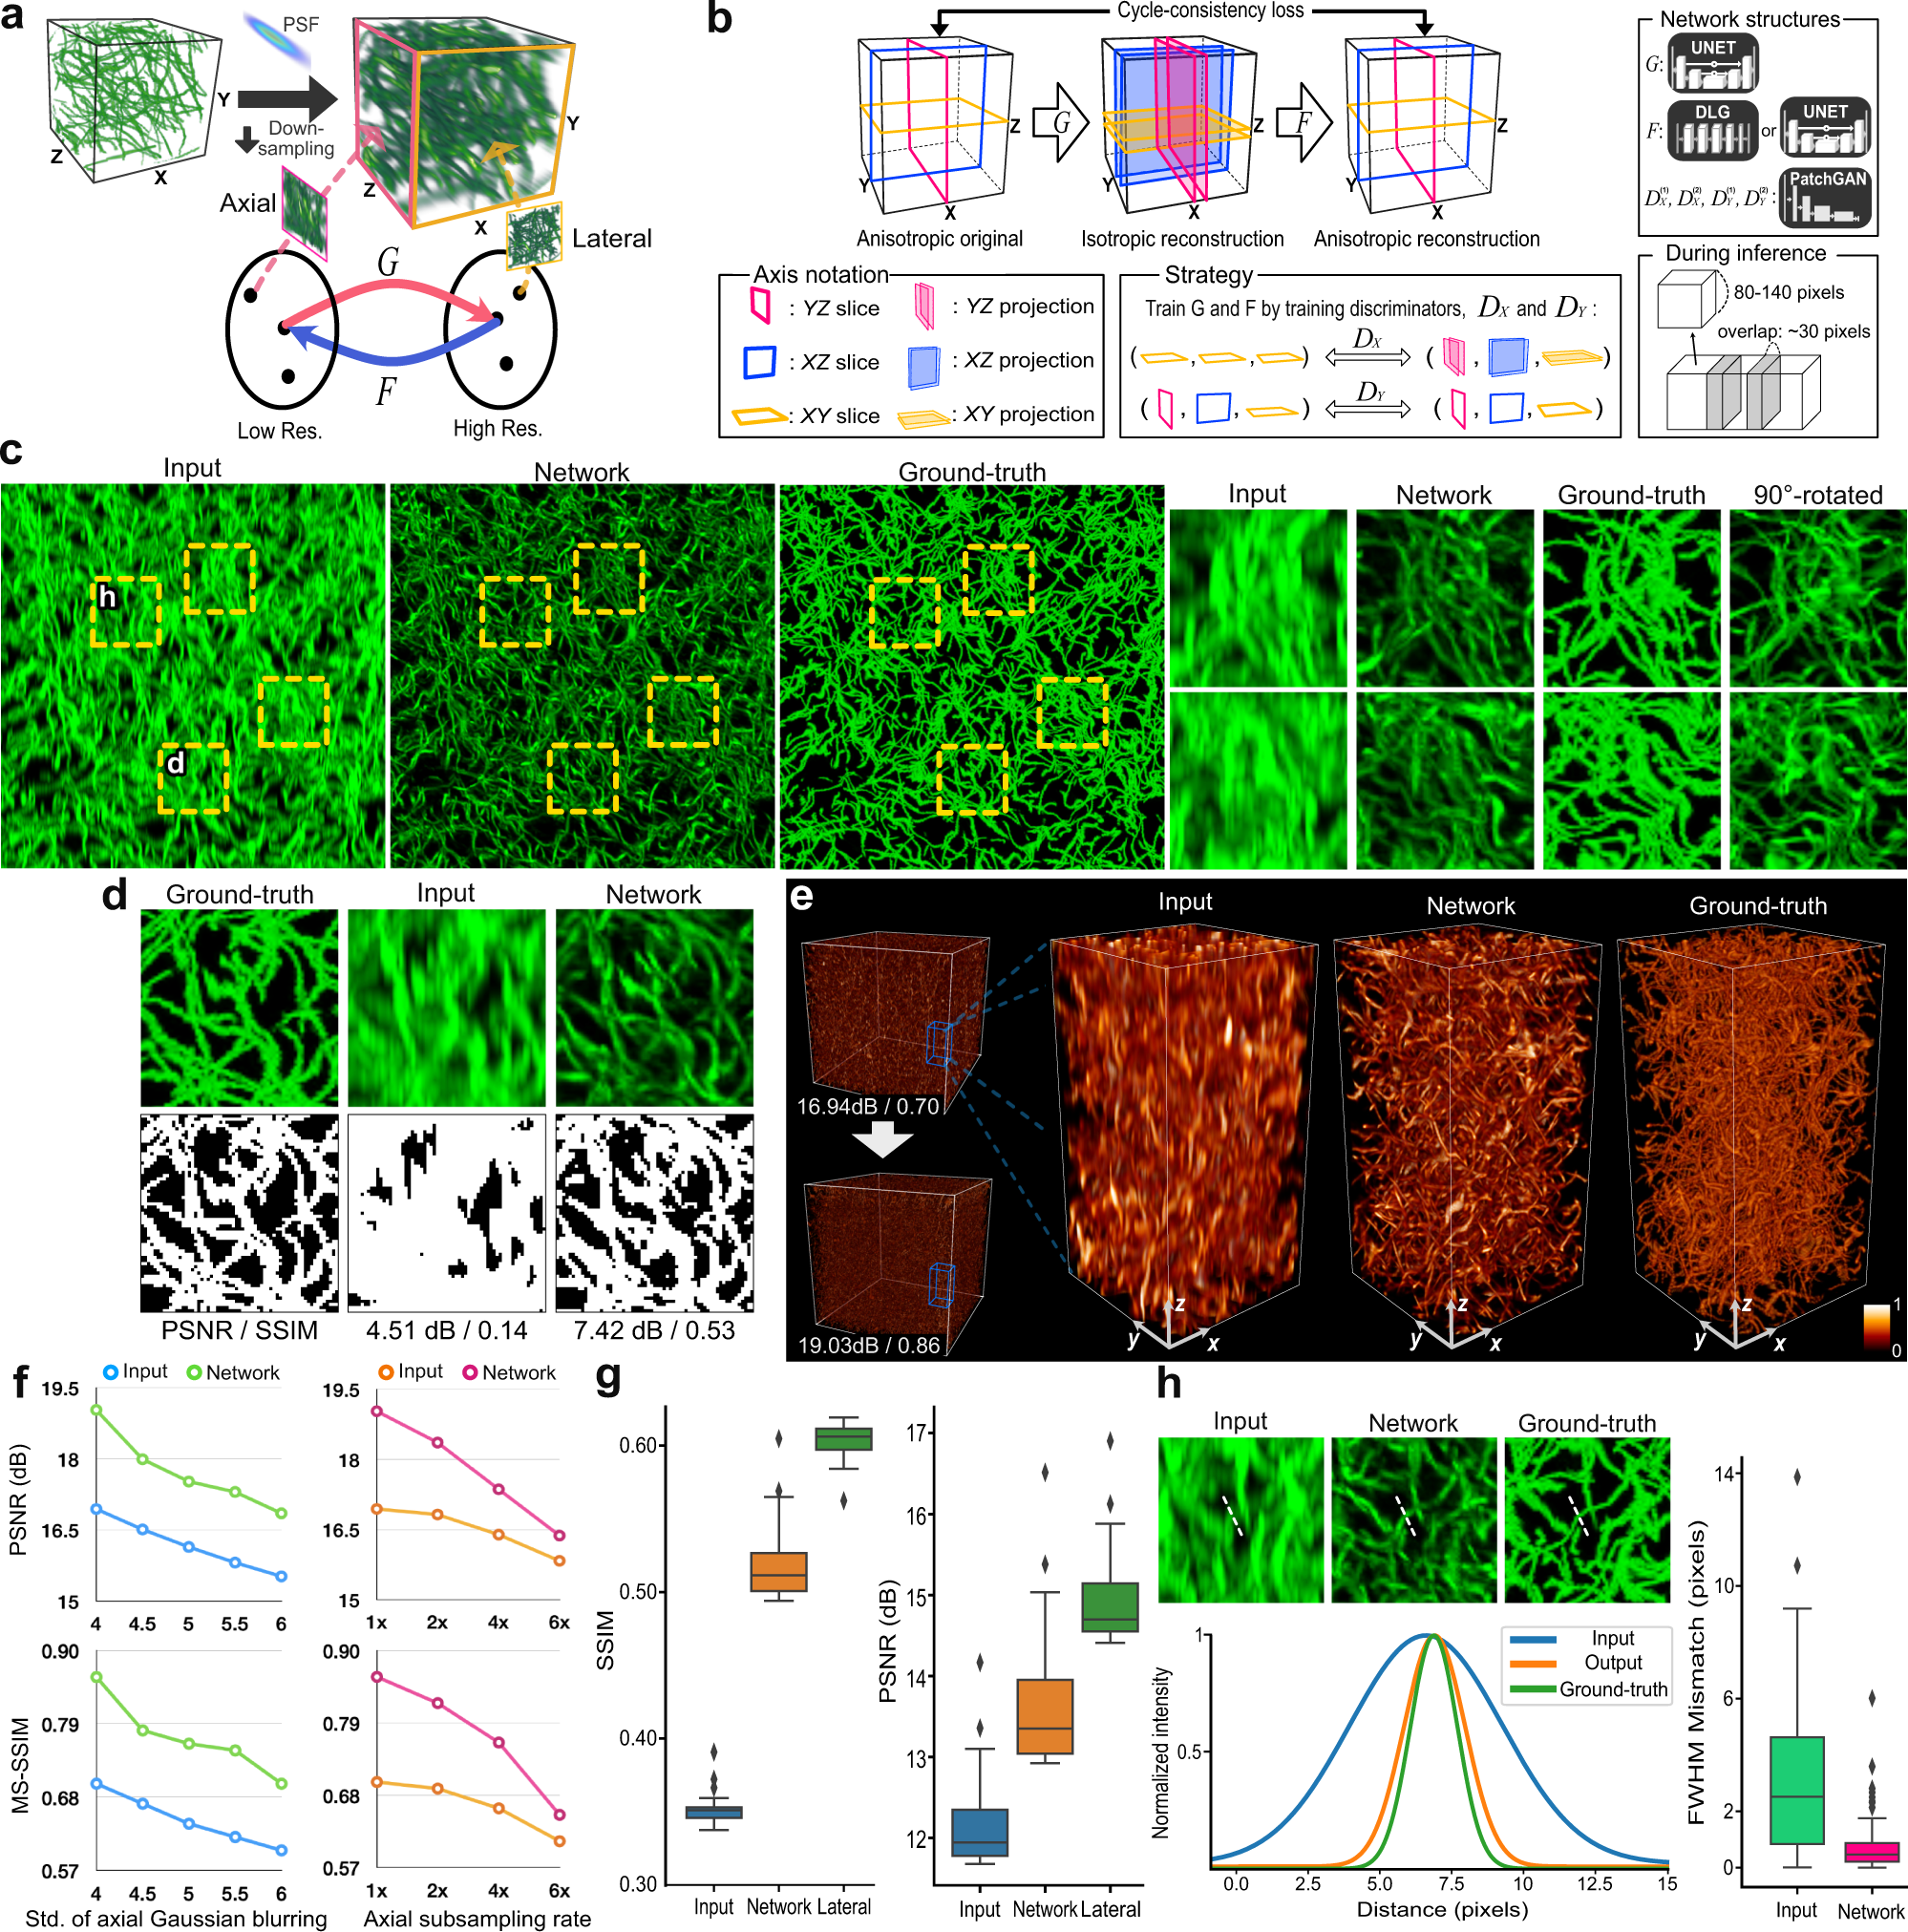
Fig. 1: Framework schematics and simulation studies.

a In fluorescence microscopy, 3D imaging is often subject to anisotropy that arises from light diffraction and under-sampling in the scanning direction. Our approach for single-sample super-resolution is to learn two-way transformations, G and F, between the high-resolution manifold and the low-resolution manifold, by sampling from lateral and axial slices or lateral and axial MIPs. b Schematic of the framework. The generative networks, G and F, learn the data-specific transformation mapping between low-resolution images and high-resolution images by learning to super-resolve axial images and revert the process, respectively. G and F use 3D convolution layers, and the discriminative networks, DX and DY, drive the learning process for G and F and use 2D convolution layers. Inference on a large-scale volume is carried out iteratively on sub-volumes with overlapping neighboring blocks. c Blind deconvolution results by our method, with zoomed-in ROIs (shown as yellow-dotted boxes) additionally for (d) and (h). d Assessment of reconstruction accuracy in 2D. The signals were segmented from the background using Otsu’s method, shown with PSNR and SSIM for quantification. e 3D visualization of large-scale inference. A random region of 7003 voxels was selected as a test volume to calculate PSNR and MS-SSIM. The color bar represents the signal intensity normalized between 0 and 1. f Performance comparison using PSNR and MS-SSIM on the test volume under different imaging conditions: axial blurring and z-axis undersampling. The undersampling is done after the axial Gaussian blurring with a standard deviation of 4. g Performance comparison using SSIM and PSNR of MIP images. Cross sections (n = 47 non-overlapping independent samples) were taken with 15 slice depths to generate MIP images. “Lateral” refers to lateral sections of the volume, which was rotated perpendicularly before the blurring to provide a high-resolution reference. h Resolution improvement by FWHM mismatch with the ground truth, with cross-sectional intensity profiles from marked lines in zoomed-in ROIs from c. We measured the FWHM mismatches of tubular objects (n = 317 non-overlapping independent samples) with respect to the ground truth. The reconstruction by the network output exhibits a noticeable improvement in reconstruction accuracy. To calculate FWHMs, the intensity profiles were fitted into Gaussian functions. For the box plots plotted in (g) and (h) panels, the box shows the inter-quartile range (IQR) between the first quartile (Q1) and the third quartile (Q3) of the dataset, with the central mark (horizontal line) showing the median and the whiskers indicating the minimum (Q1-1.5*IQR) and the maximum (Q3+1.5*IQR). Outliers are represented by diamond-shaped markers beyond the whiskers.
