
Fig. 2: Performance of four prognostic models in external validation.
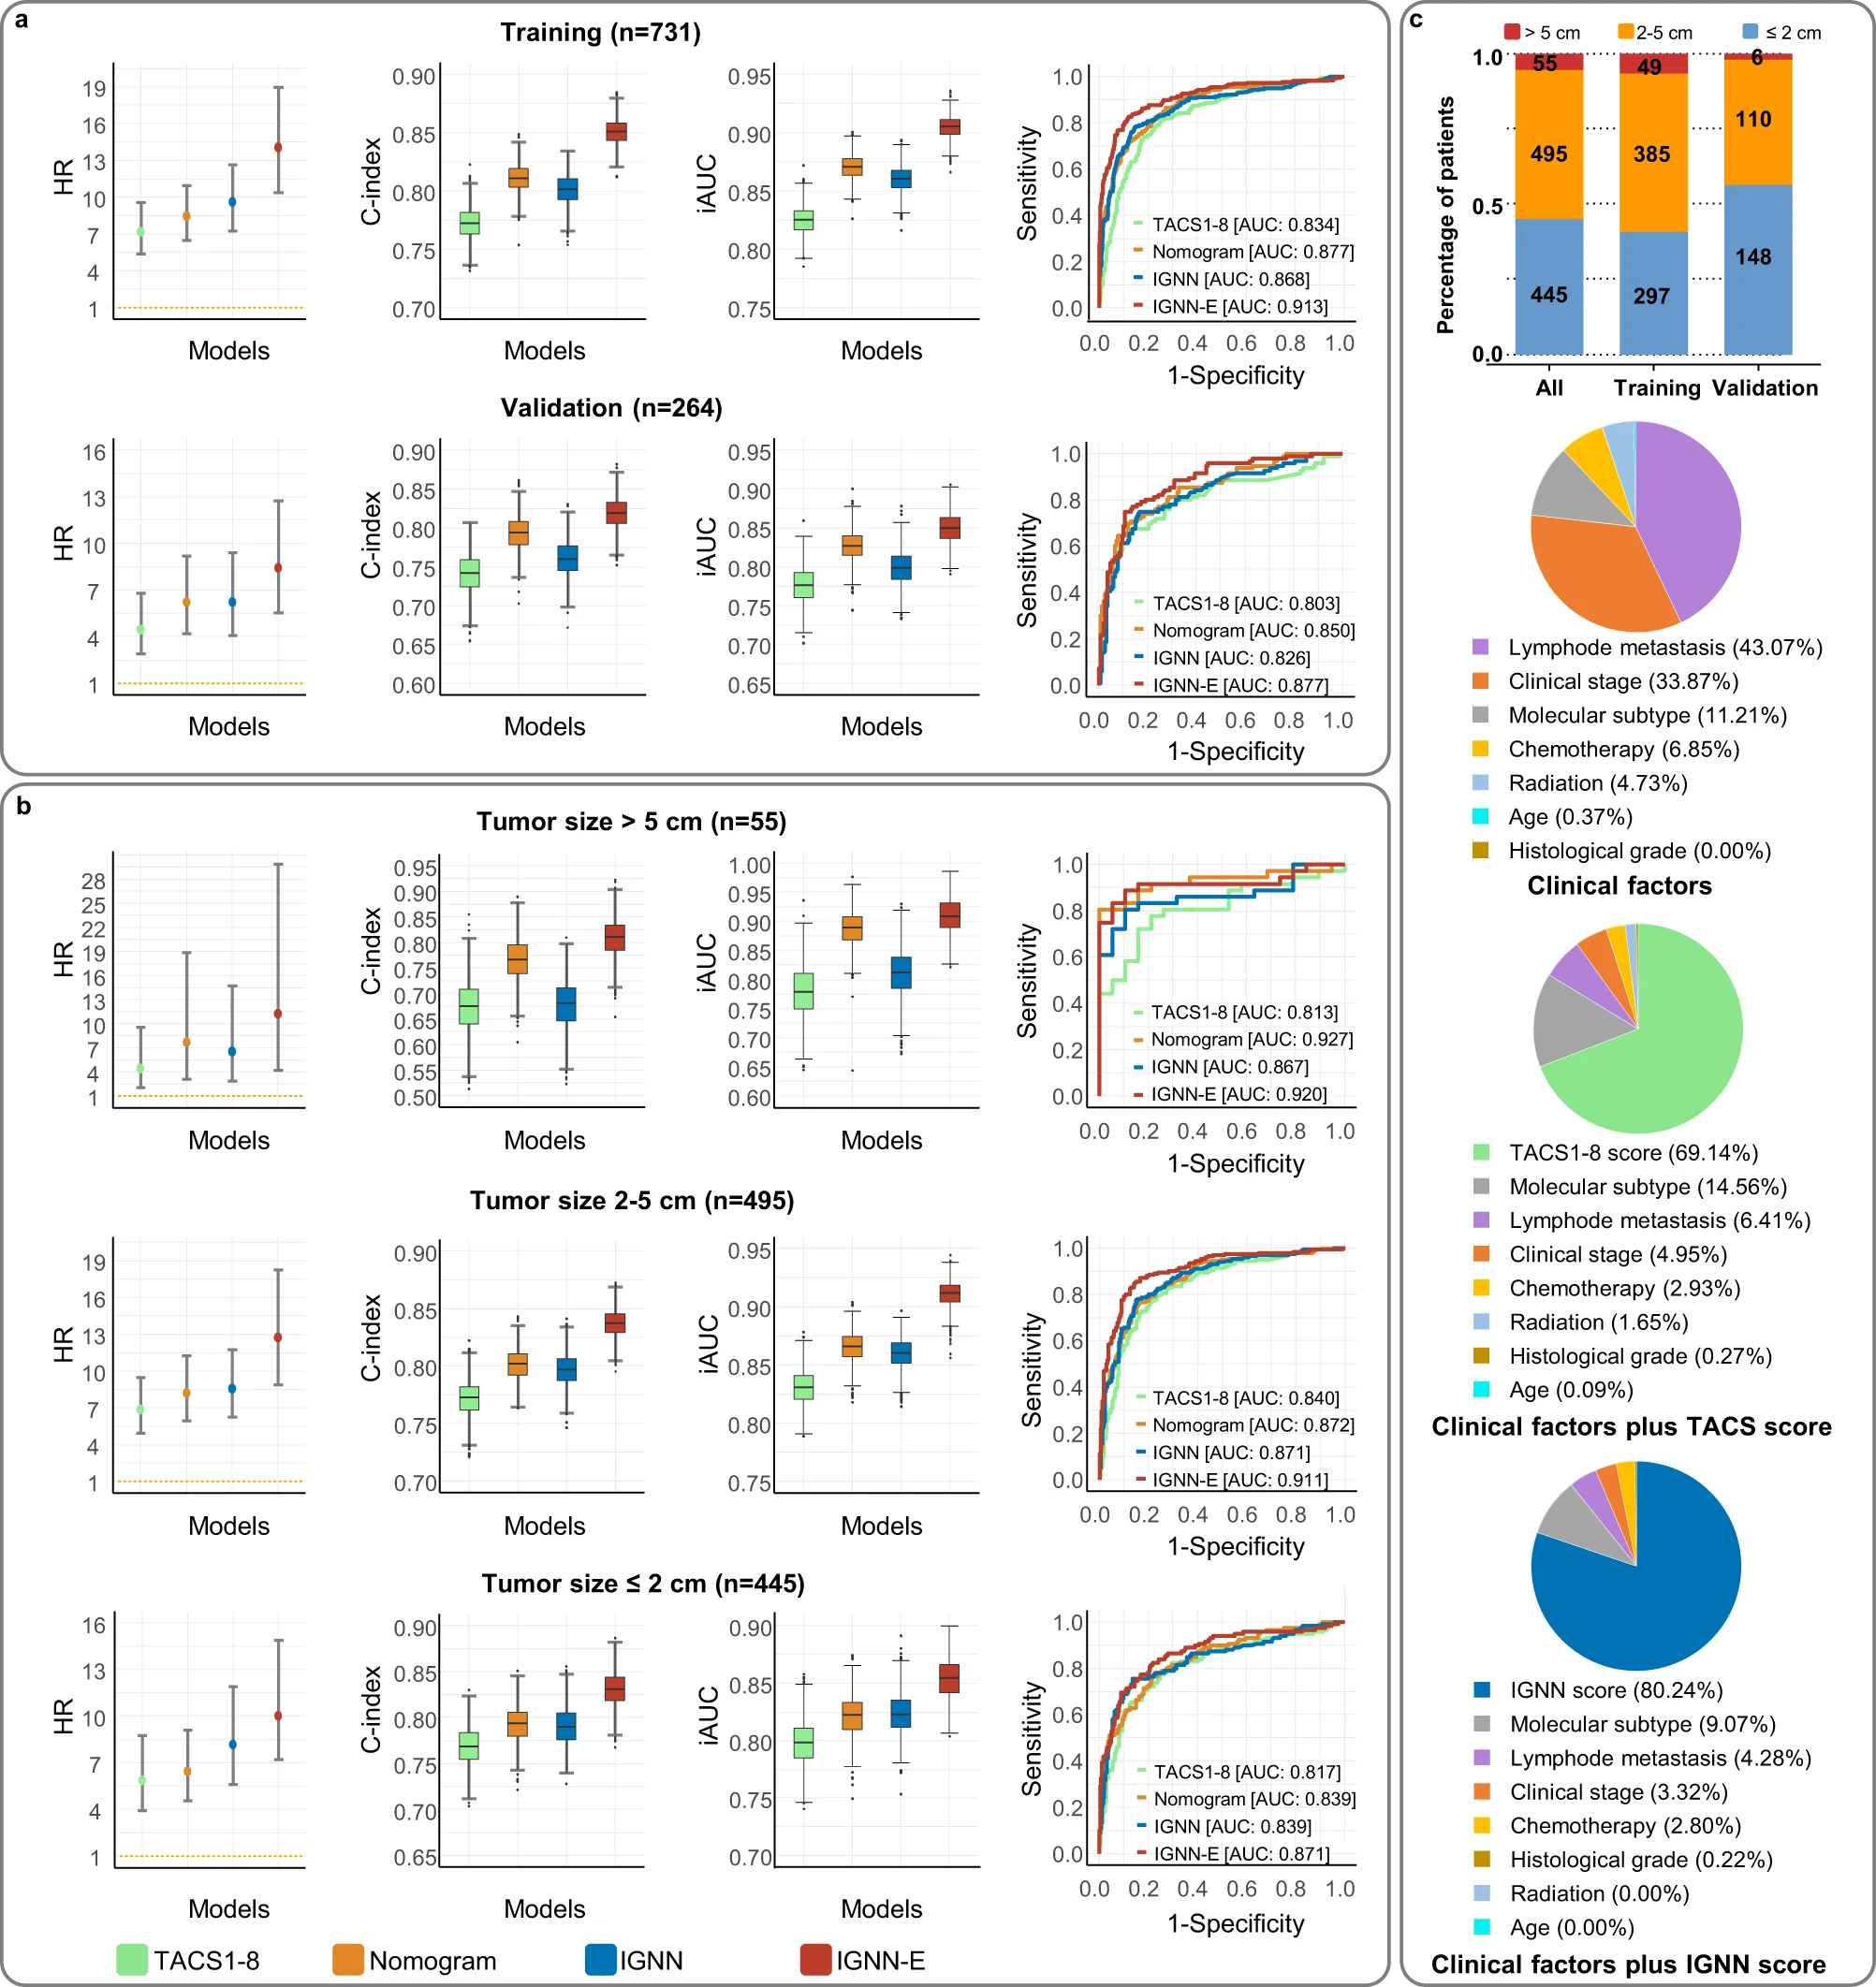
a, b HR from multivariate Cox proportional hazards regression analysis (in error bars, circles and upper/lower boundaries indicate mean value and 95% CIs, respectively. A two-sided log-rank test was performed to determine significance), distributions of C-index and iAUC from time-dependent AUC analysis (in boxplots, middle line represents the median value, the upper and lower boundaries of boxes indicate 25th and 75th percentile, the whiskers reflect 1.5 times of interquartile range, the upper and lower tails indicate the maxima and minima, and single points indicate the outliers. A two-sided unpaired t-test was performed to determine significance), and receiver operating characteristic (ROC) curves with AUC, for different groups of patients. c Tumor size distribution for patient cohorts (upper panel) and relative contributions of prognostic biomarkers in predicting DFS of 445 patients with a < 2 cm tumor from multivariate Cox proportional hazard regression analysis (lower panels). Chi-squared test was performed to determine significance. HR hazard ratio, C-index concordance index, AUC associated area under receiver operating characteristic curves, iAUC integrated cumulative/dynamic AUC, TACS (TACS1-8) tumor-associated collagen signatures, Nomogram, extended model of multivariate Cox proportional hazard regression, IGNN intratumor graph neural network, IGNN-E extended IGNN model with clinical information. Source data are provided as a Source Data file.
