
Fig. 1: Cement and concrete cycle and associated-CO2 fluxes in Japan in 2019.
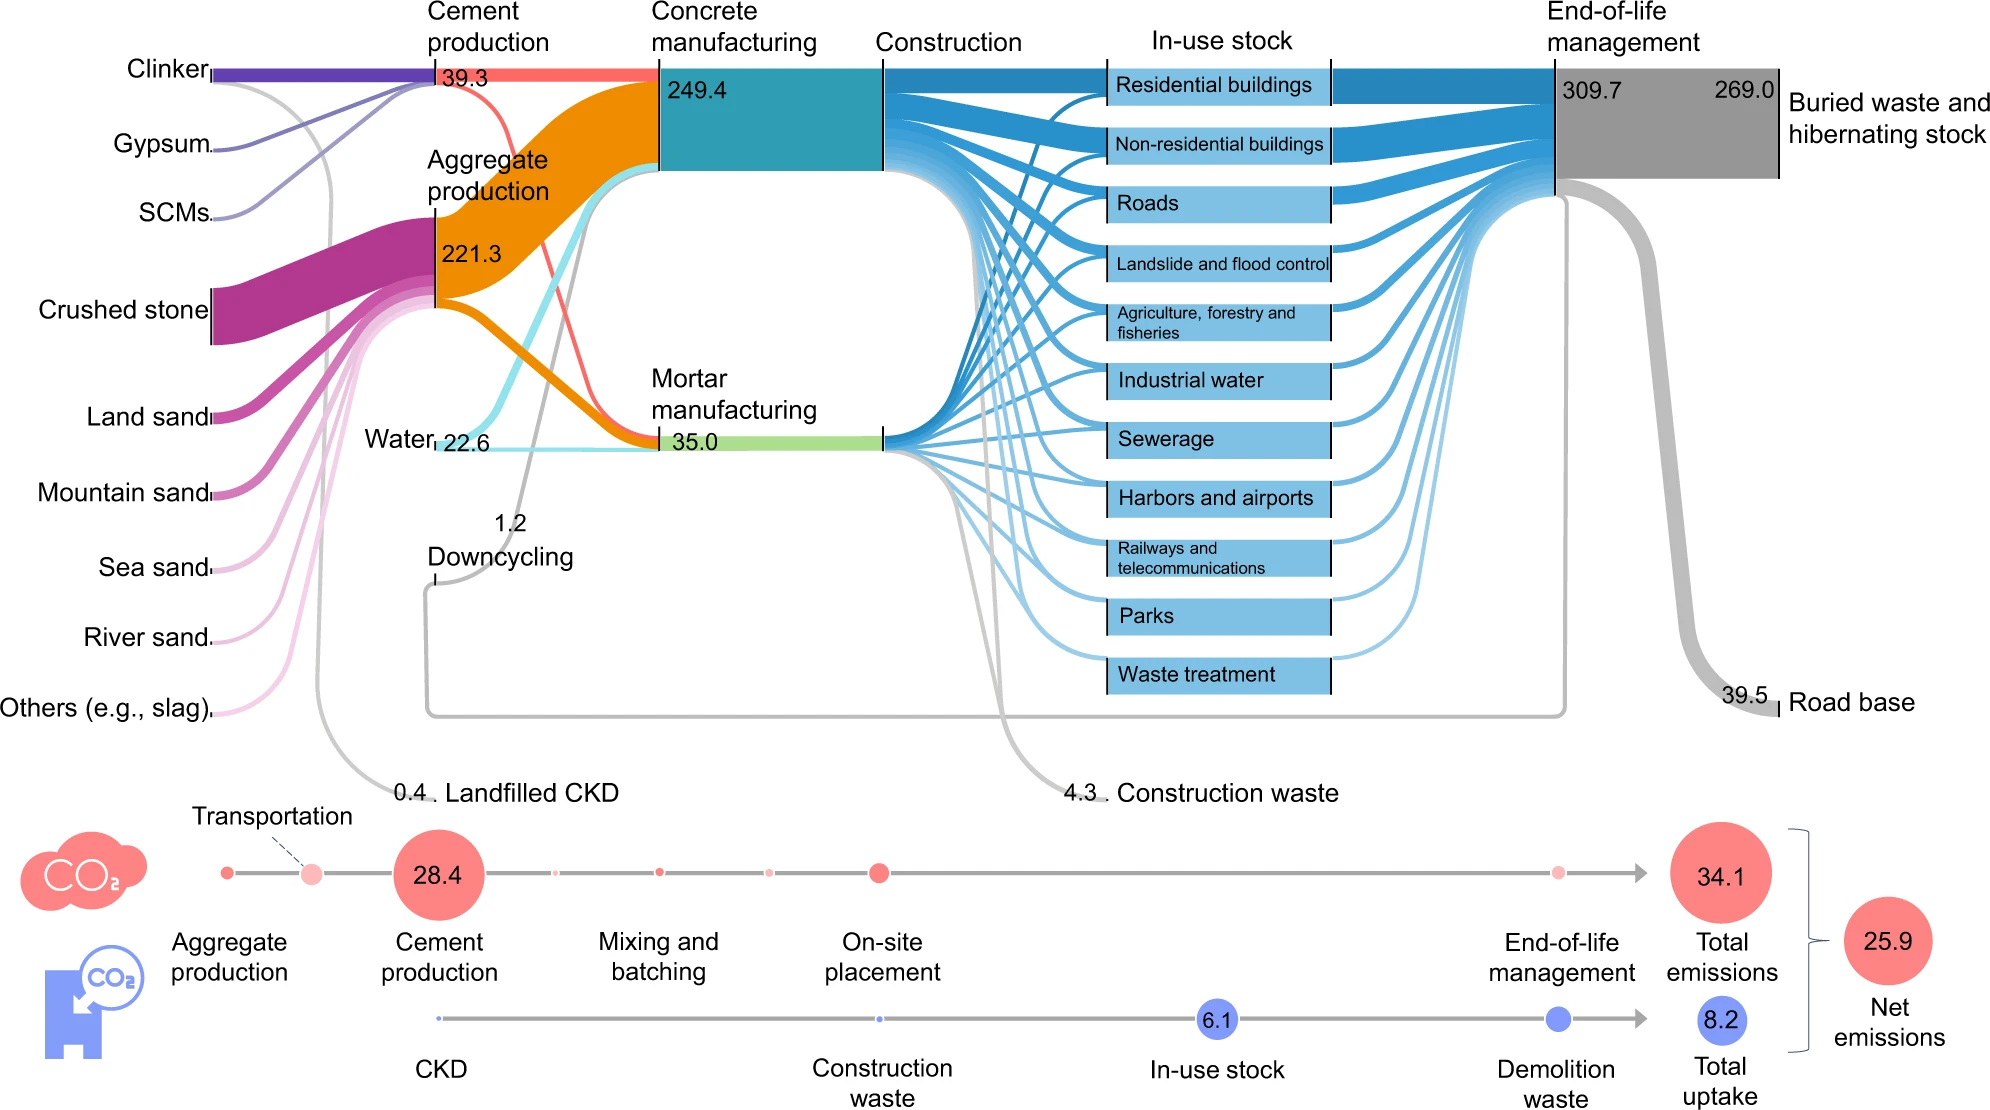
All flows are shown to scale in Mt/year; in-use stocks shown in the box are scaled differently than flows. The numbers in the circles at the bottom of the figure show the annual CO2 emissions and uptake associated with the concrete cycle in Mt-CO2/year. The Sankey diagram was designed with floWeaver63. SCMs supplementary cementitious materials, CKD cement kiln dust.
