
Fig. 1: Characterization of the gastric cancer tumor microenvironment by scRNA-seq.
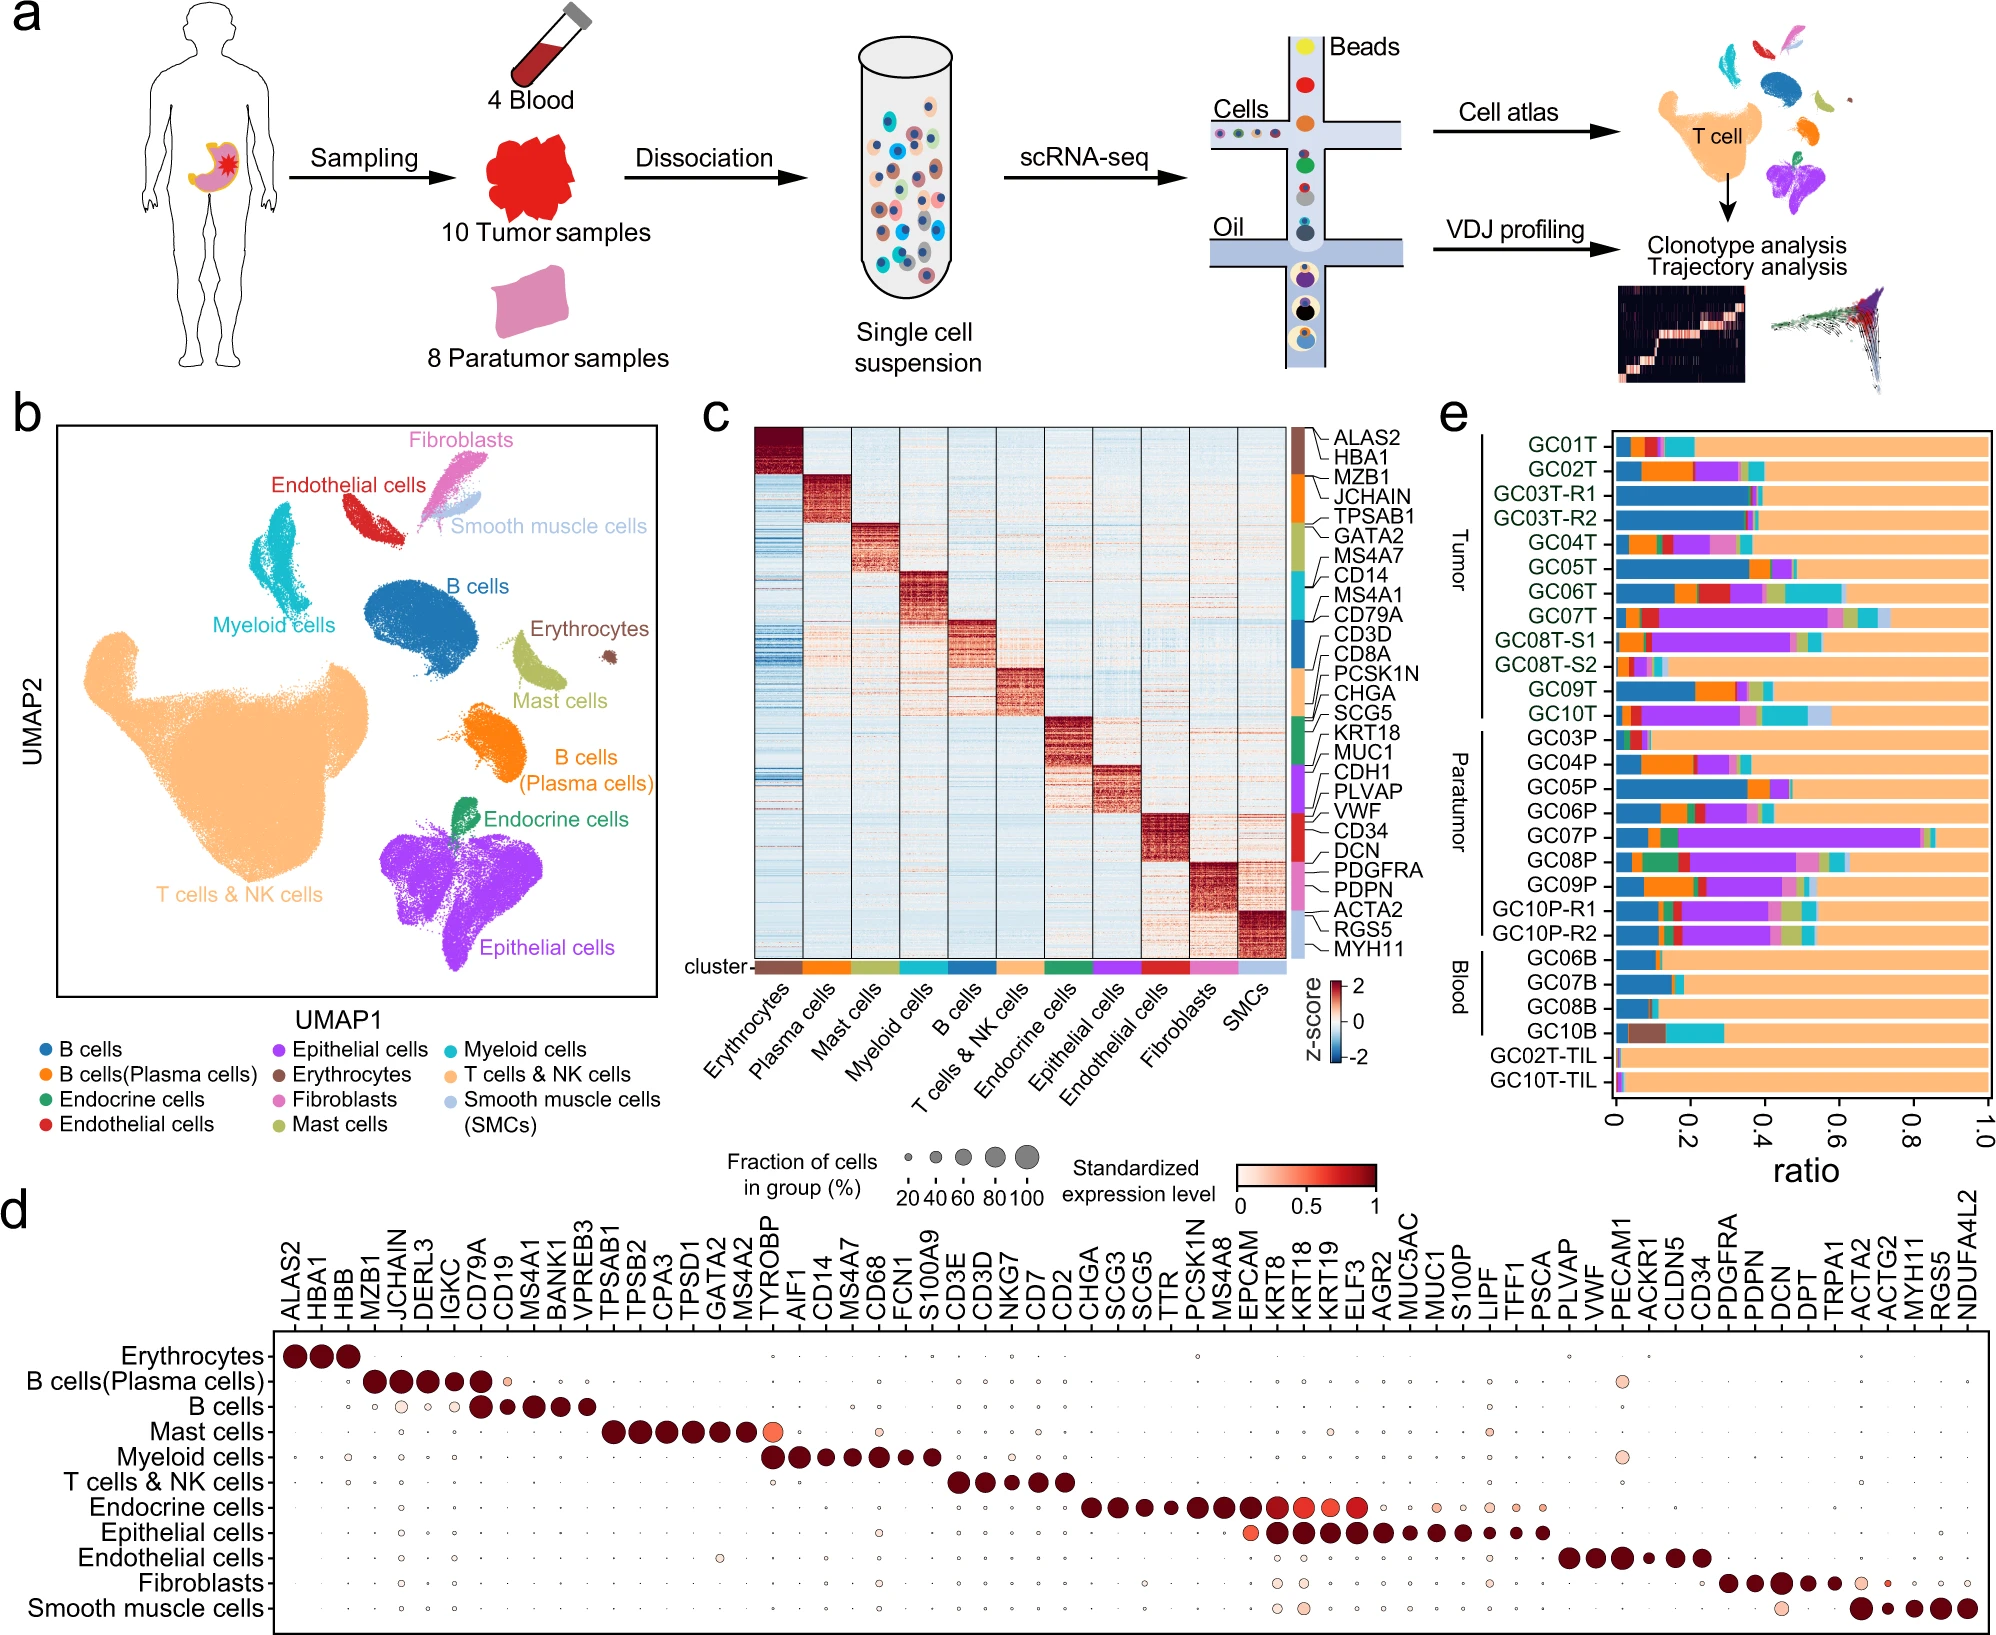
a Workflow depicting sample processing and scRNA sequencing of gastric cancer (GC), peripheral blood, and paratumor cells and subsequent analytical methods. b Uniform Manifold Approximation and Projection (UMAP) of 166,533 single cells from 10 patients, colored by major cell types. c Heatmap showing the differentially expressed genes (rows) across major cell types (columns), with canonical marker genes indicated. d Dot plots showing marker genes for clusters in Fig. 1b. Dot size indicates the proportion of expressing cells, colored by standardized expression levels. e Fractions of cell types detected in each sample, colored as in Fig. 1b. GC01–GC10 represent 10 GC patients; B/P/T represent cells isolated from blood, paratumor, and tumor tissues, respectively; TIL represents tumor-infiltrating lymphocyte; GC03T-R1/R2 and GC10P-R1/R2 represent two technical replicates; GC08T-S1/S2 represent two different sites of the same tumor tissue. Source data are provided as a Source Data file.
