
Fig. 4: Dissection of myeloid cells showing the expansion of lipid-associated macrophages in tumor tissues.
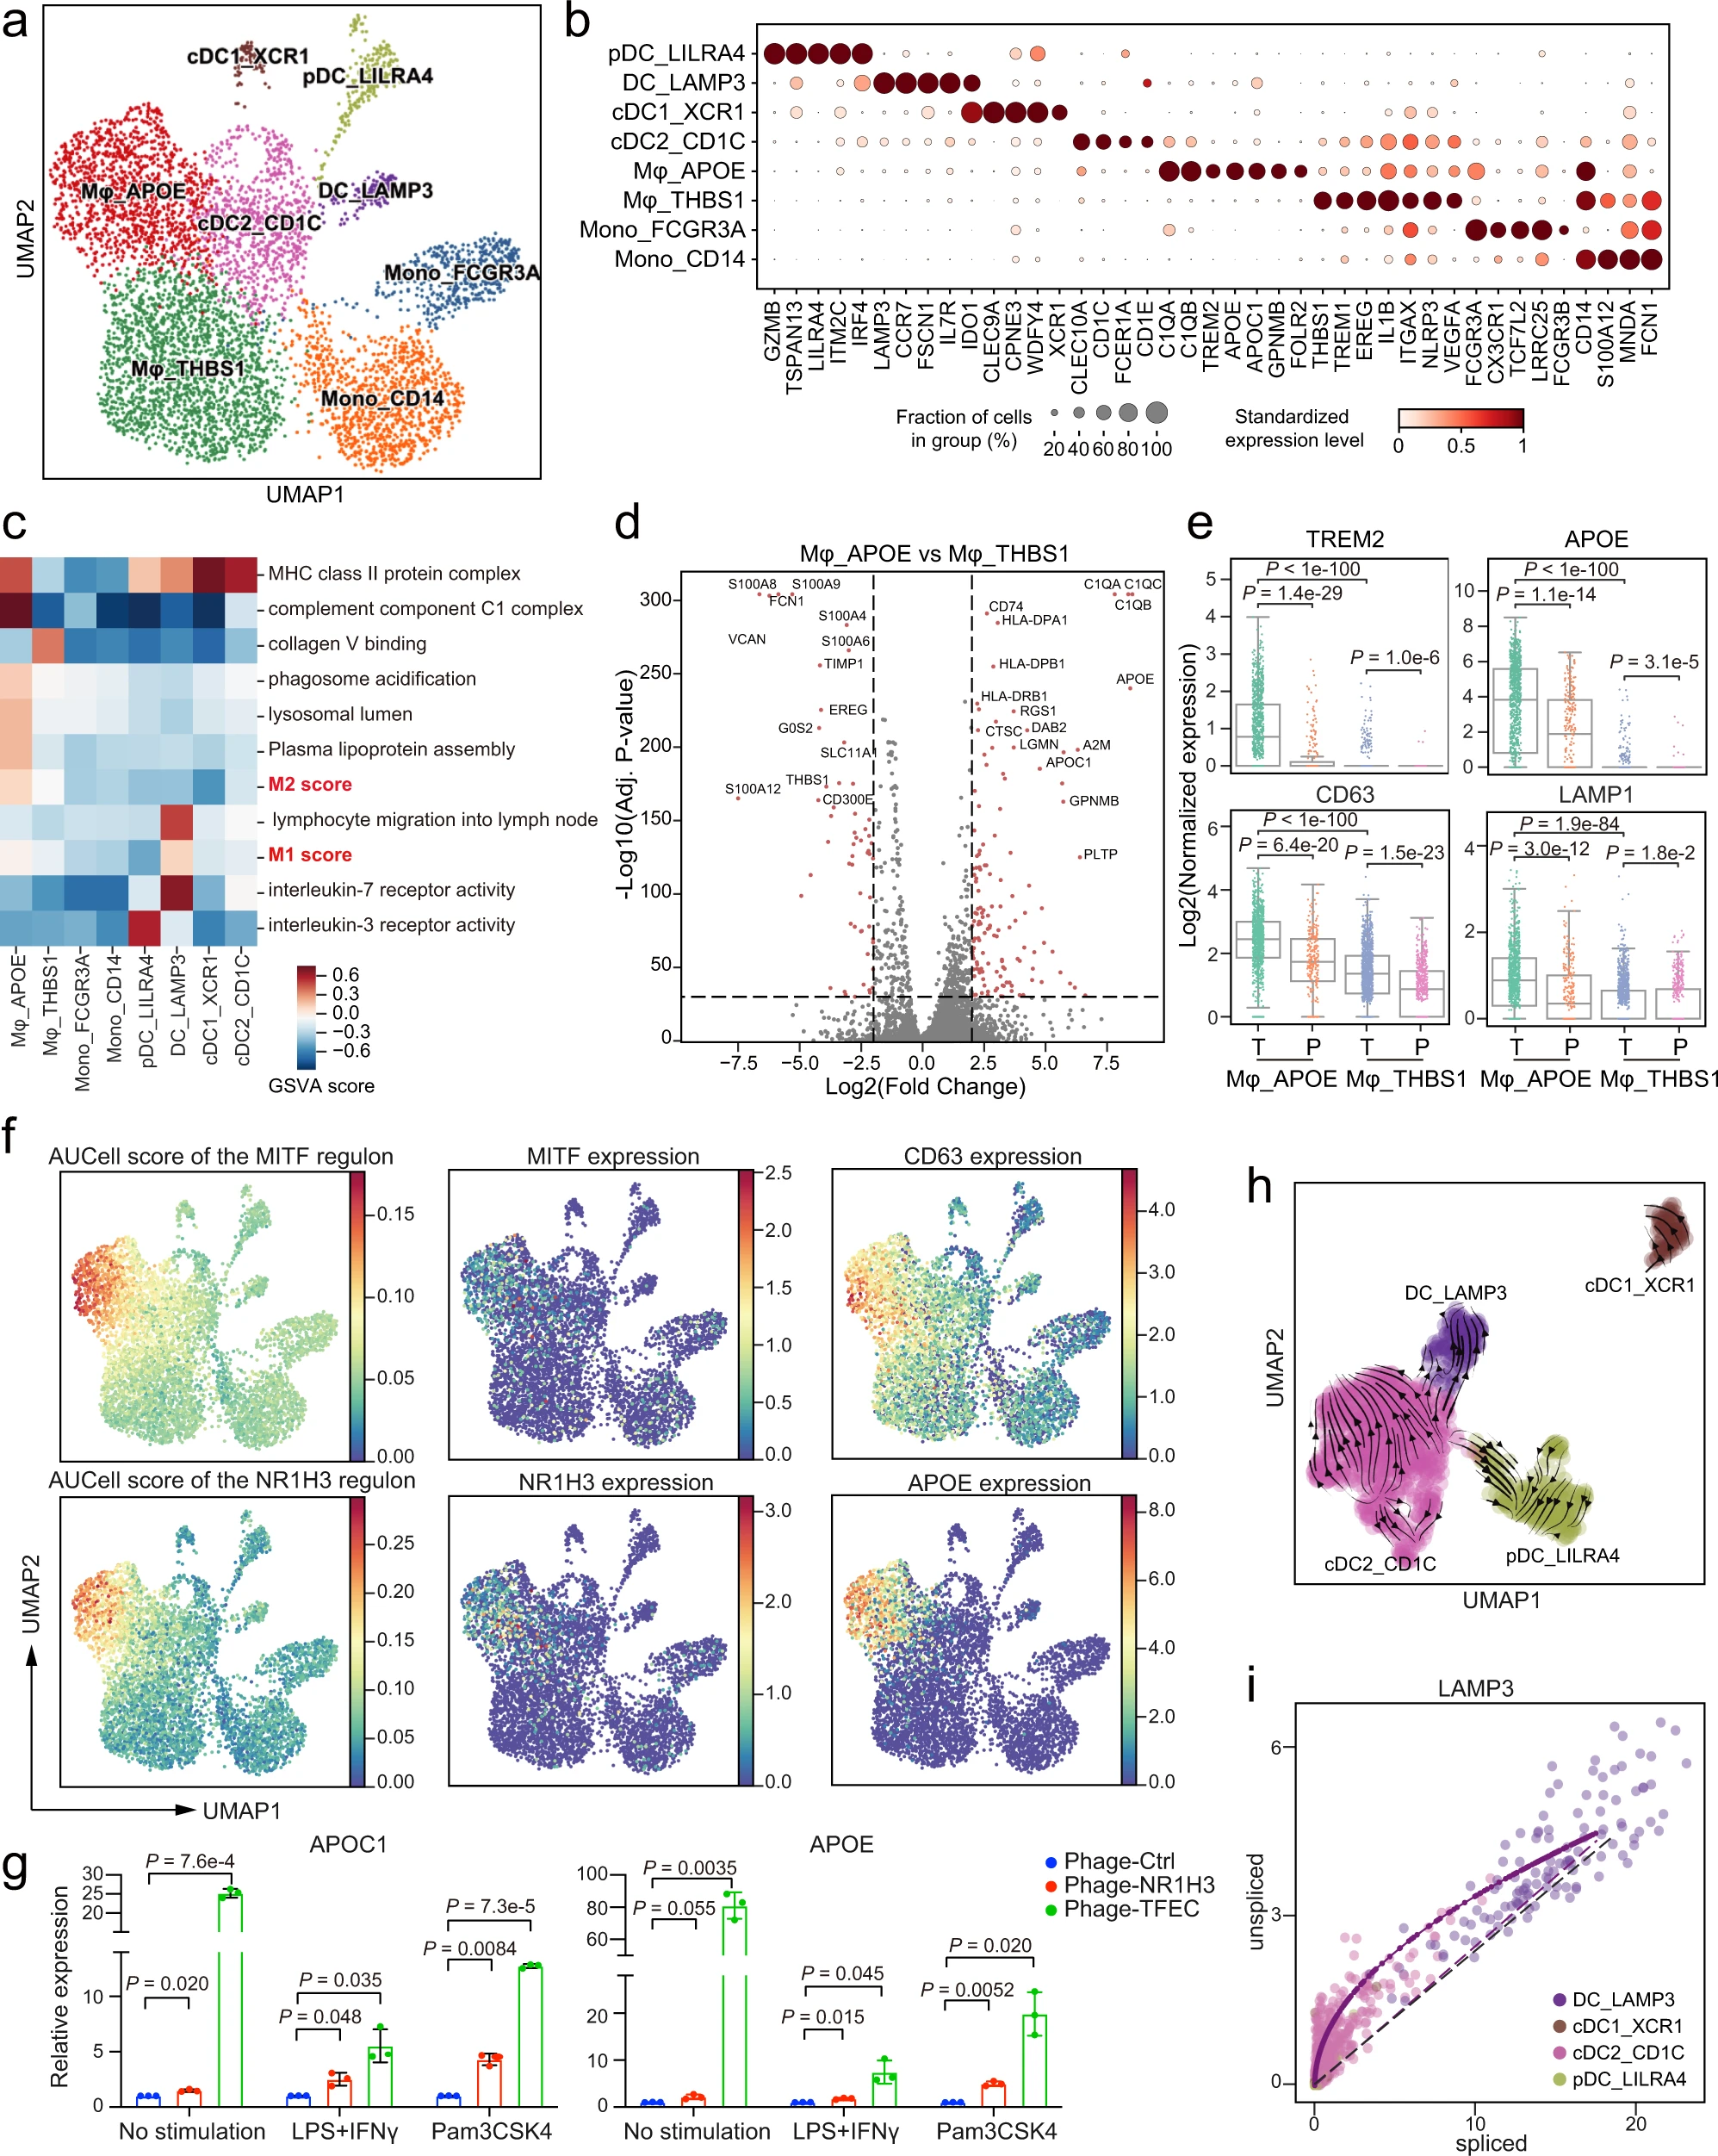
a UMAP of myeloid cells. Clusters are labeled with inferred cell types. b Dot plots showing marker genes across myeloid cell subsets. Dot size indicates the proportion of expressing cells, colored by standardized expression levels. c Differences in pathway activities scored by GSVA among the different myeloid cell clusters. The scores of pathways are z-score-normalized. d Volcano plot showing differentially expressed genes between Mφ_APOE and Mφ_THBS1. Dotted lines indicate p-value < 1e−20 and |log2 (FC)| > 2 (two-sided Wilcoxon rank-sum test). e Boxplot showing lysosomal and lipid-related gene expression in macrophages. Each dot represents a single cell. T and P represent tumor and paratumor tissues, respectively. (two-sided Wilcoxon rank-sum test, n = 1236 for Mφ_THBS1_T, n = 926 for Mφ_APOE_T, n = 544 for Mφ_THBS1_P, n = 244 for Mφ_APOE_P). f UMAP of myeloid cells, colored by the AUCell scores of the TF regulon activity of NR1H3 and MITF, or by the normalized expression of genes. g NR1H3 or TFEC overexpressed THP-1-derived macrophages were stimulated with lipopolysaccharide (LPS) + interferon γ (IFNγ) or Pam3CSK4. The expressions of APOE and APOC1 were then measured by qPCR. Each column represents the mean ± SD of three independent experiments (two-sided t-test). h UMAP showing the inferred development dynamics of DC subsets by RNA velocity. i Velocity analysis of the spliced and unspliced mRNAs of LAMP3 in DCs. Each dot represents one cell. Source data are provided as a Source Data file.
