
Fig. 5: Dissection and clustering of T cells implicating multiple distinct functional states and gene modules in GC ecosystem.
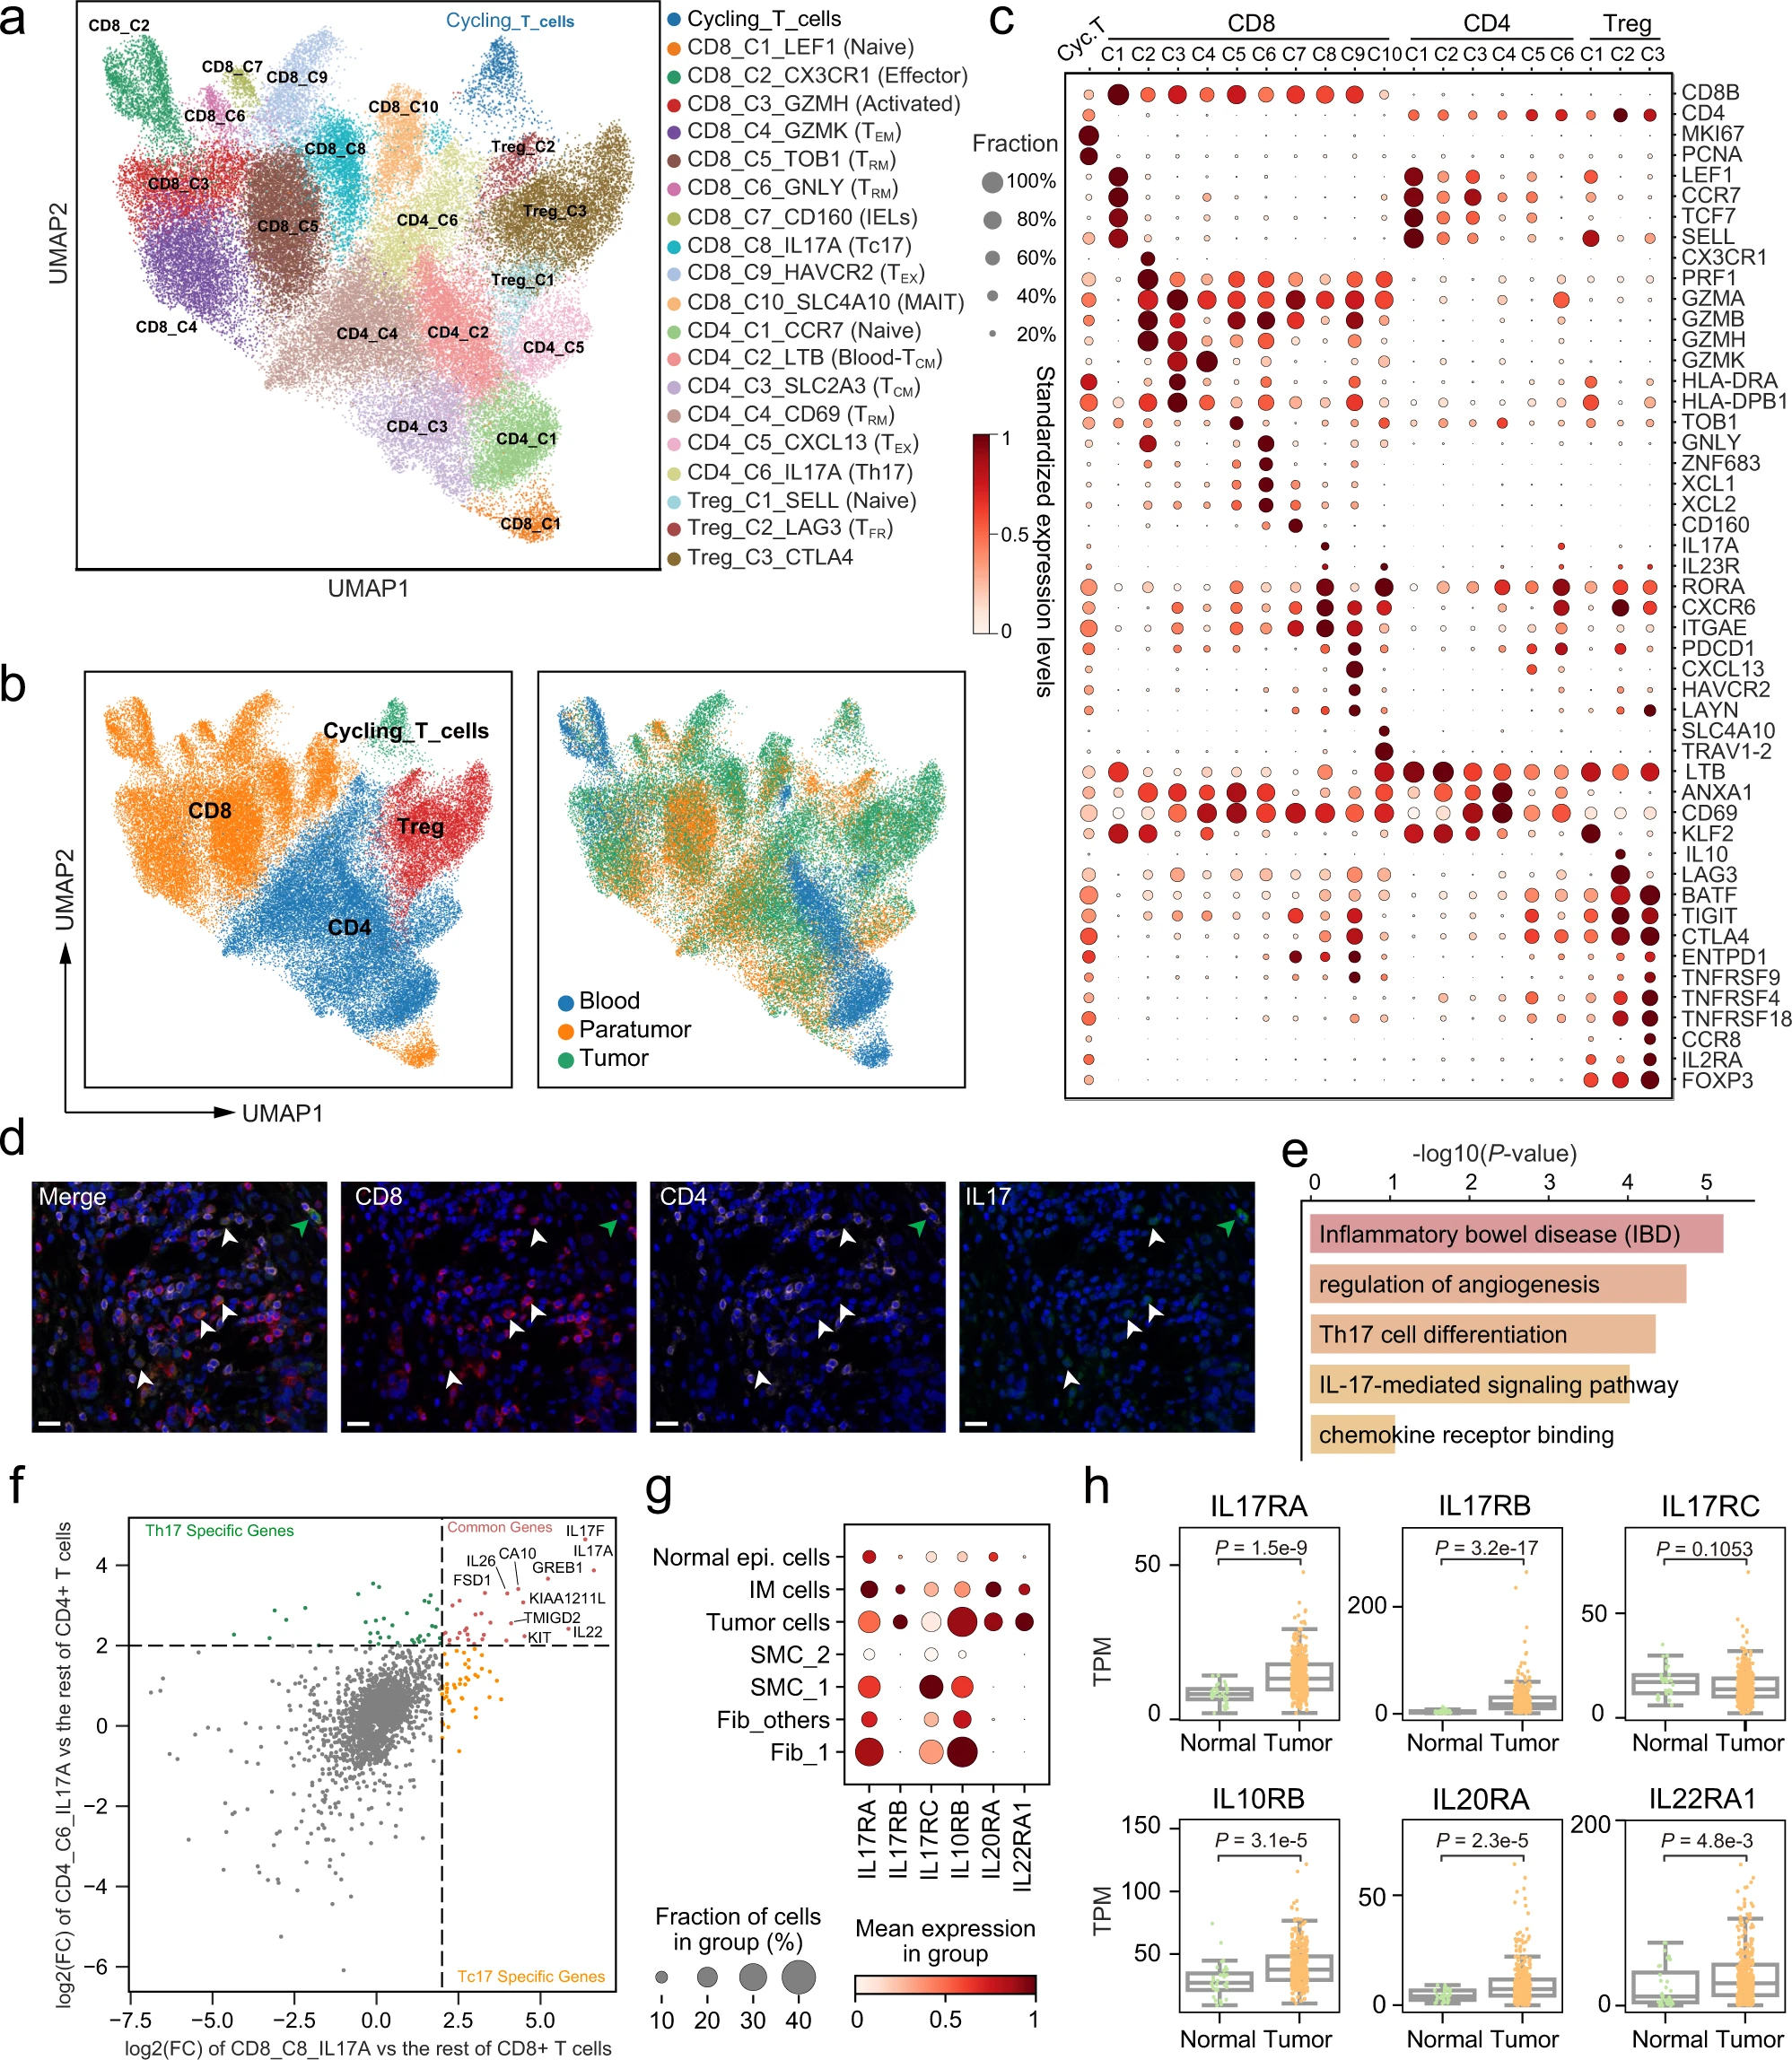
a UMAP of T cells that had both scRNA-seq data and paired TCR information. Clusters are labeled with inferred cell types. b Dot plots showing marker genes across T cell subsets. Dot size indicates the proportion of expressing cells, colored by standardized expression levels. c UMAP of T cells colored by cell type (left) and cellular tissue origin (right). d Multicolor IHC staining with anti-CD4, anti-CD8, and anti-IL17A antibodies, exemplified by patient GC988401 (n = 6). The white and green arrows indicate CD8+IL17+ cells and CD4+IL17+ cells, respectively. The scale bar represents 20 μm. e Bar plot of the KEGG terms or pathways enriched for highly expressed genes in Tc17, the p-values were calculated by the hypergeometric distribution. f Scatterplot showing the log2 fold change of differentially expressed genes. CD8_C9_HAVCR2 versus other CD8+ T cells (X-axis); Treg_C3_CTLA4 versus other CD4+ T cells (Y-axis). Each dot represents a gene, with color annotation inside. g Dot plots showing the expression of genes encoding the receptors for IL17A, IL17F (IL17RA/IL17RC), IL22 (IL10RB/IL22RA1), and IL26 (IL20RA/IL10RB) in scRNA-seq dataset. h Box plots showing the expression of genes encoding the receptors for IL17A, IL17F (IL17RA/IL17RC), IL22 (IL10RB/IL22RA1), and IL26 (IL20RA/IL10RB) in tumor (n = 375) and normal tissue (n = 32) of TCGA-STAD dataset, grouped by tissue origin (two-sided Wilcoxon rank-sum test). Source data are provided as a Source Data file.
