
Fig. 6: Phenotype transition of CD8+ T cells based on both TCR sharing and trajectory analysis.
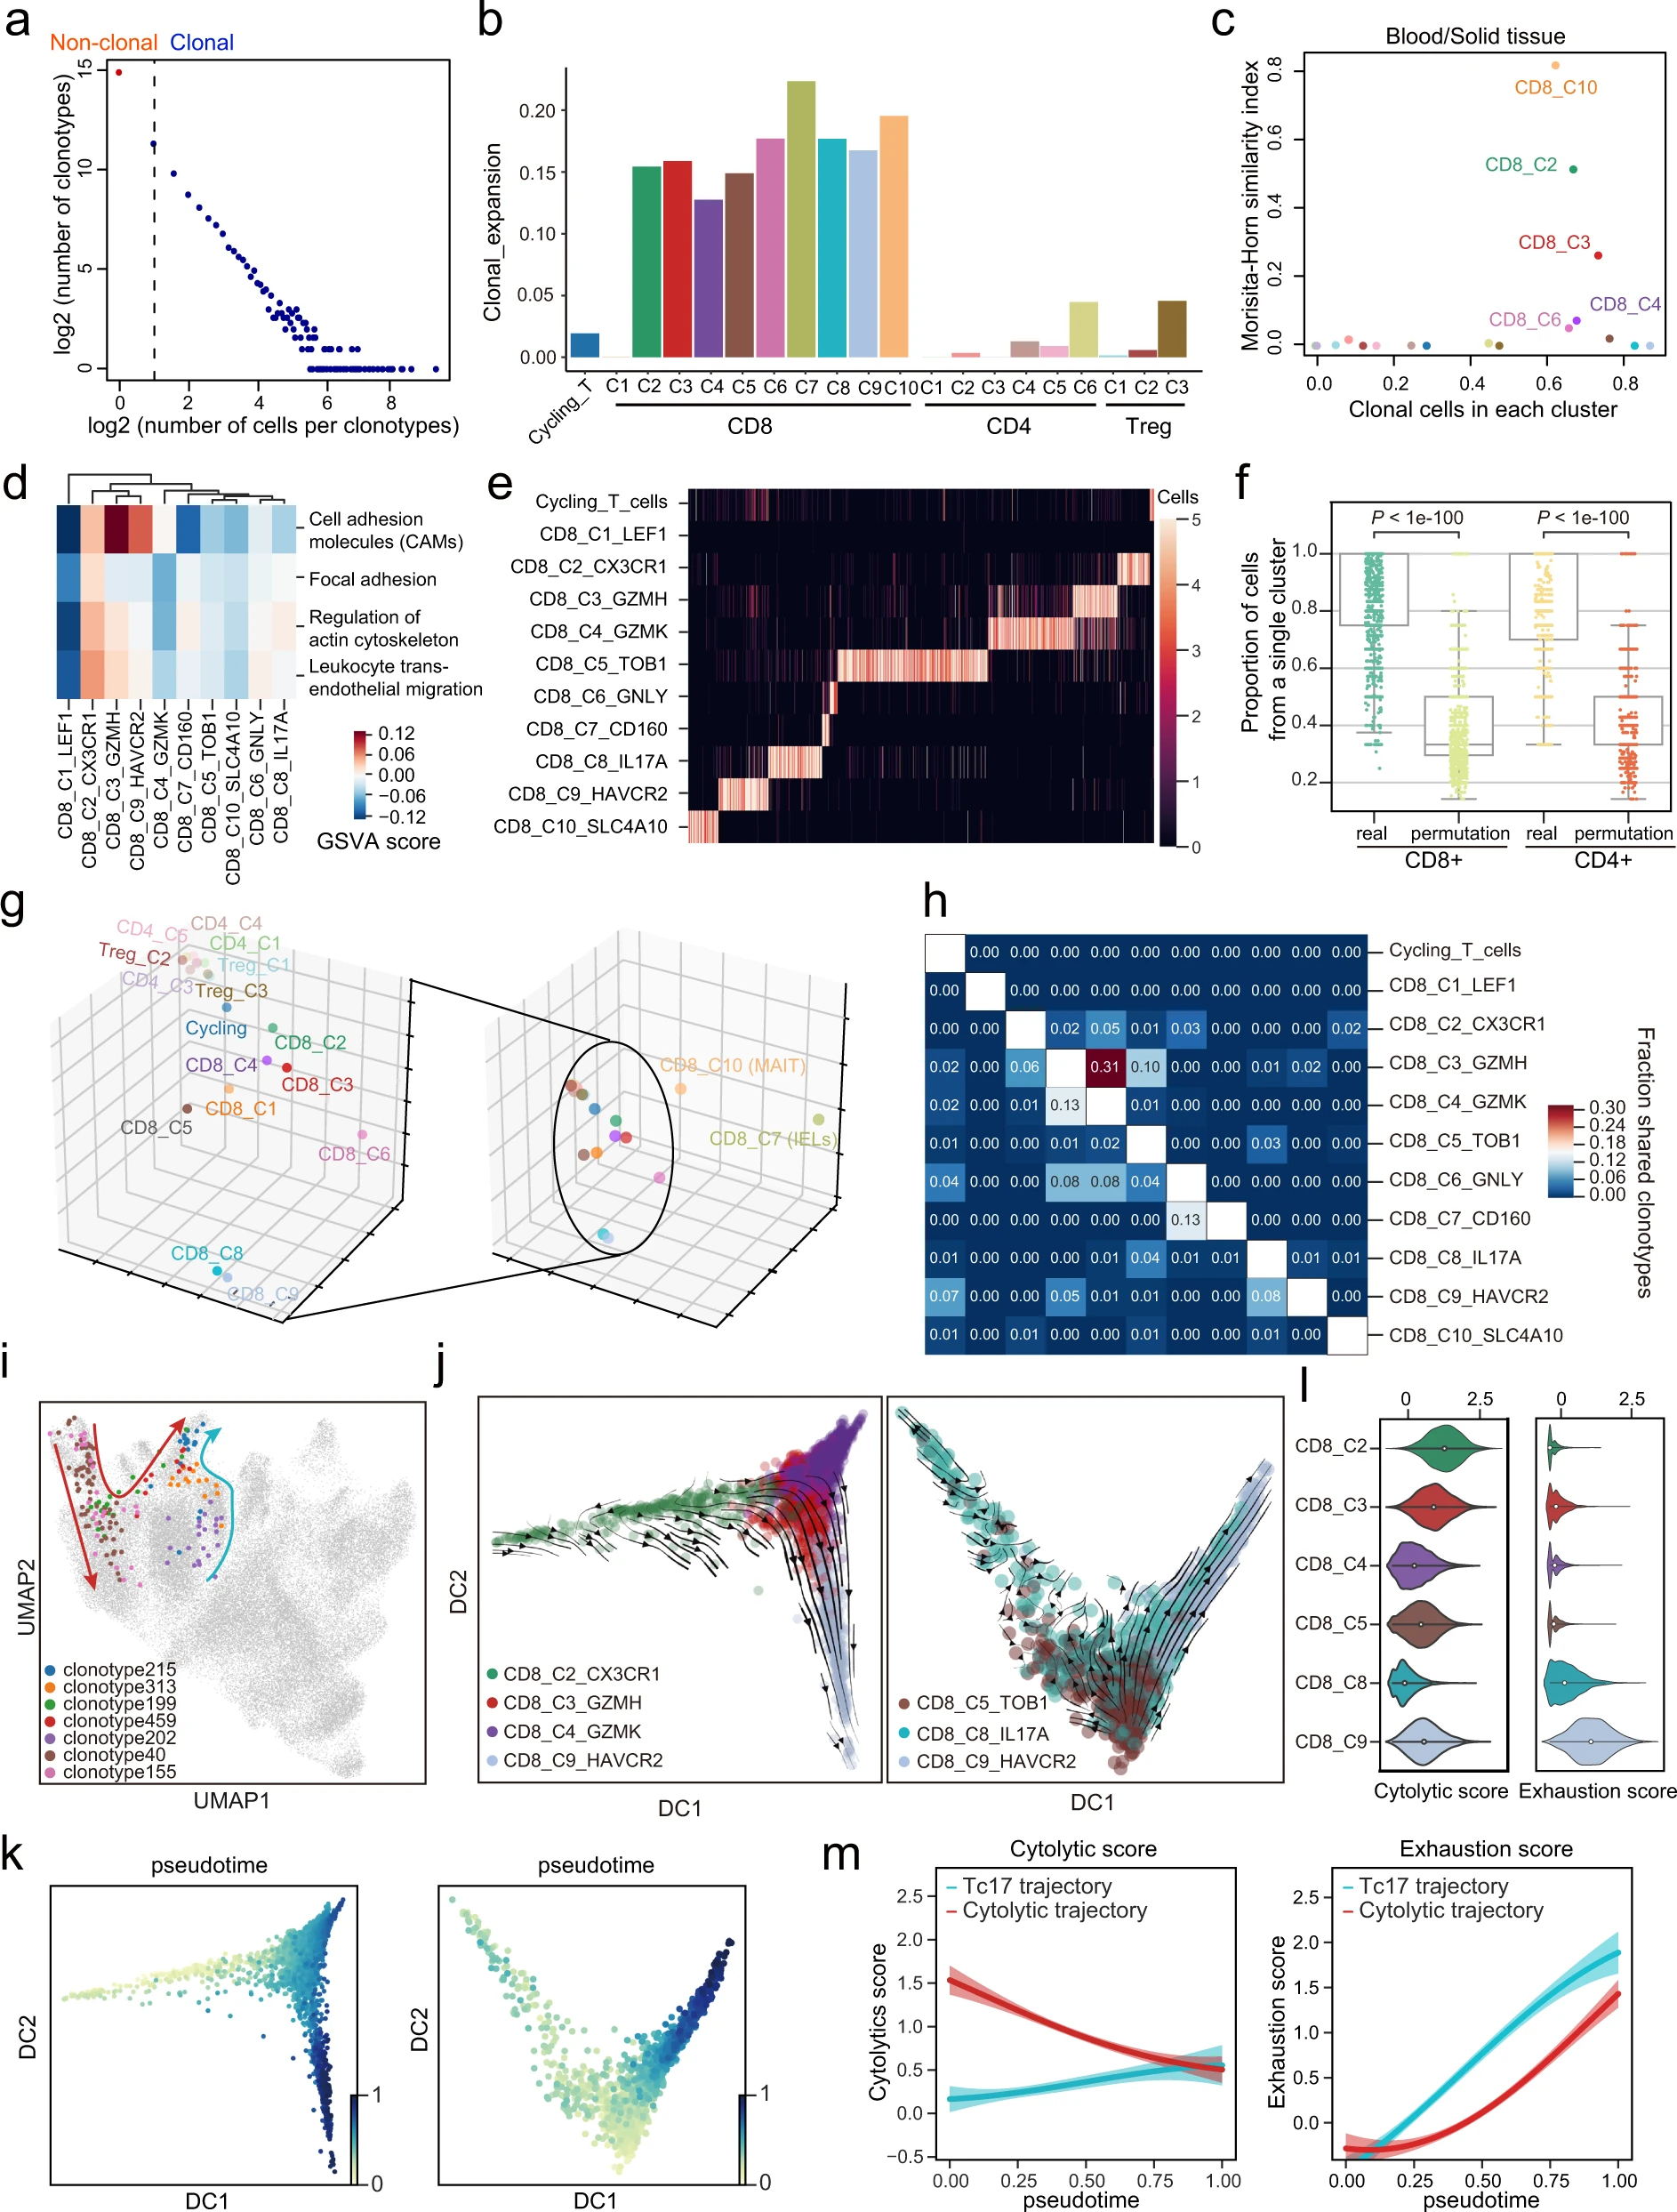
a The association between the number of T cell clones and the number of cells per clonotype. The dashed line separates non-clonal and clonal cells, with the latter identified by repeated usage of TCRs. b Bar plot showing the score of clonal expansion in each T cell subset. c Comparison between the proportions of clonal cells (x-axis), and the clone sharing between blood and solid tissues estimated by Morisita–Horn similarity index (y-axis) in each cluster. d Differences in migration-related pathway activities scored by GSVA among different CD8+ T cell subsets. e The distribution of clonal clonotypes in CD8+ T-cell subsets and cycling T cells. Lighter color indicates higher cell number; Cell numbers were capped at 5. f Proportions of cells from a single cluster for each clonotype. Permutation was performed among cluster labels and clonotype labels (two-sided Wilcoxon rank-sum test, n = 1558 for both real and permutated CD8+ T cell clonotypes, n = 1046 for both real and permutated CD4+ T cell clonotypes). g Three-dimensional plots showing the PCA embedding of T-cell subsets according to the bias in VDJ-gene usage of each cluster. h Heat map showing the fraction of clonotypes belonging to a primary phenotype cluster (rows) that are shared with other secondary phenotype clusters (columns). i UMAP of T cells colored by selected TCR clonotypes. Red and cyan arrows indicate the state transition of blood-derived and tissue-derived CD8+ T cells, respectively. j Diffusion maps showing the RNA velocity of cells from the cytolytic trajectory (left) and the Tc17 trajectory (right). k Diffusion maps showing the pseudotime of the cytolytic trajectory (left) and the Tc17 trajectory (right), which were calculated according to RNA velocity. l Violin plot showing the cytolytic score (left) and the exhaustion score (right). m Gaussian process regression curves with a 95% confidence interval showing the dynamics of the cytolytic score (left) and the exhaustion score (right) along the pseudotime of the cytolytic trajectory (excluding CD8_C4_GZMK) and the Tc17 trajectory, respectively. Source data are provided as a Source Data file.
