
Fig. 7: Dynamics of TF activities along the T-cell exhaustion trajectories and the potential promoting effect of IL17+ T cells on gastric tumors.
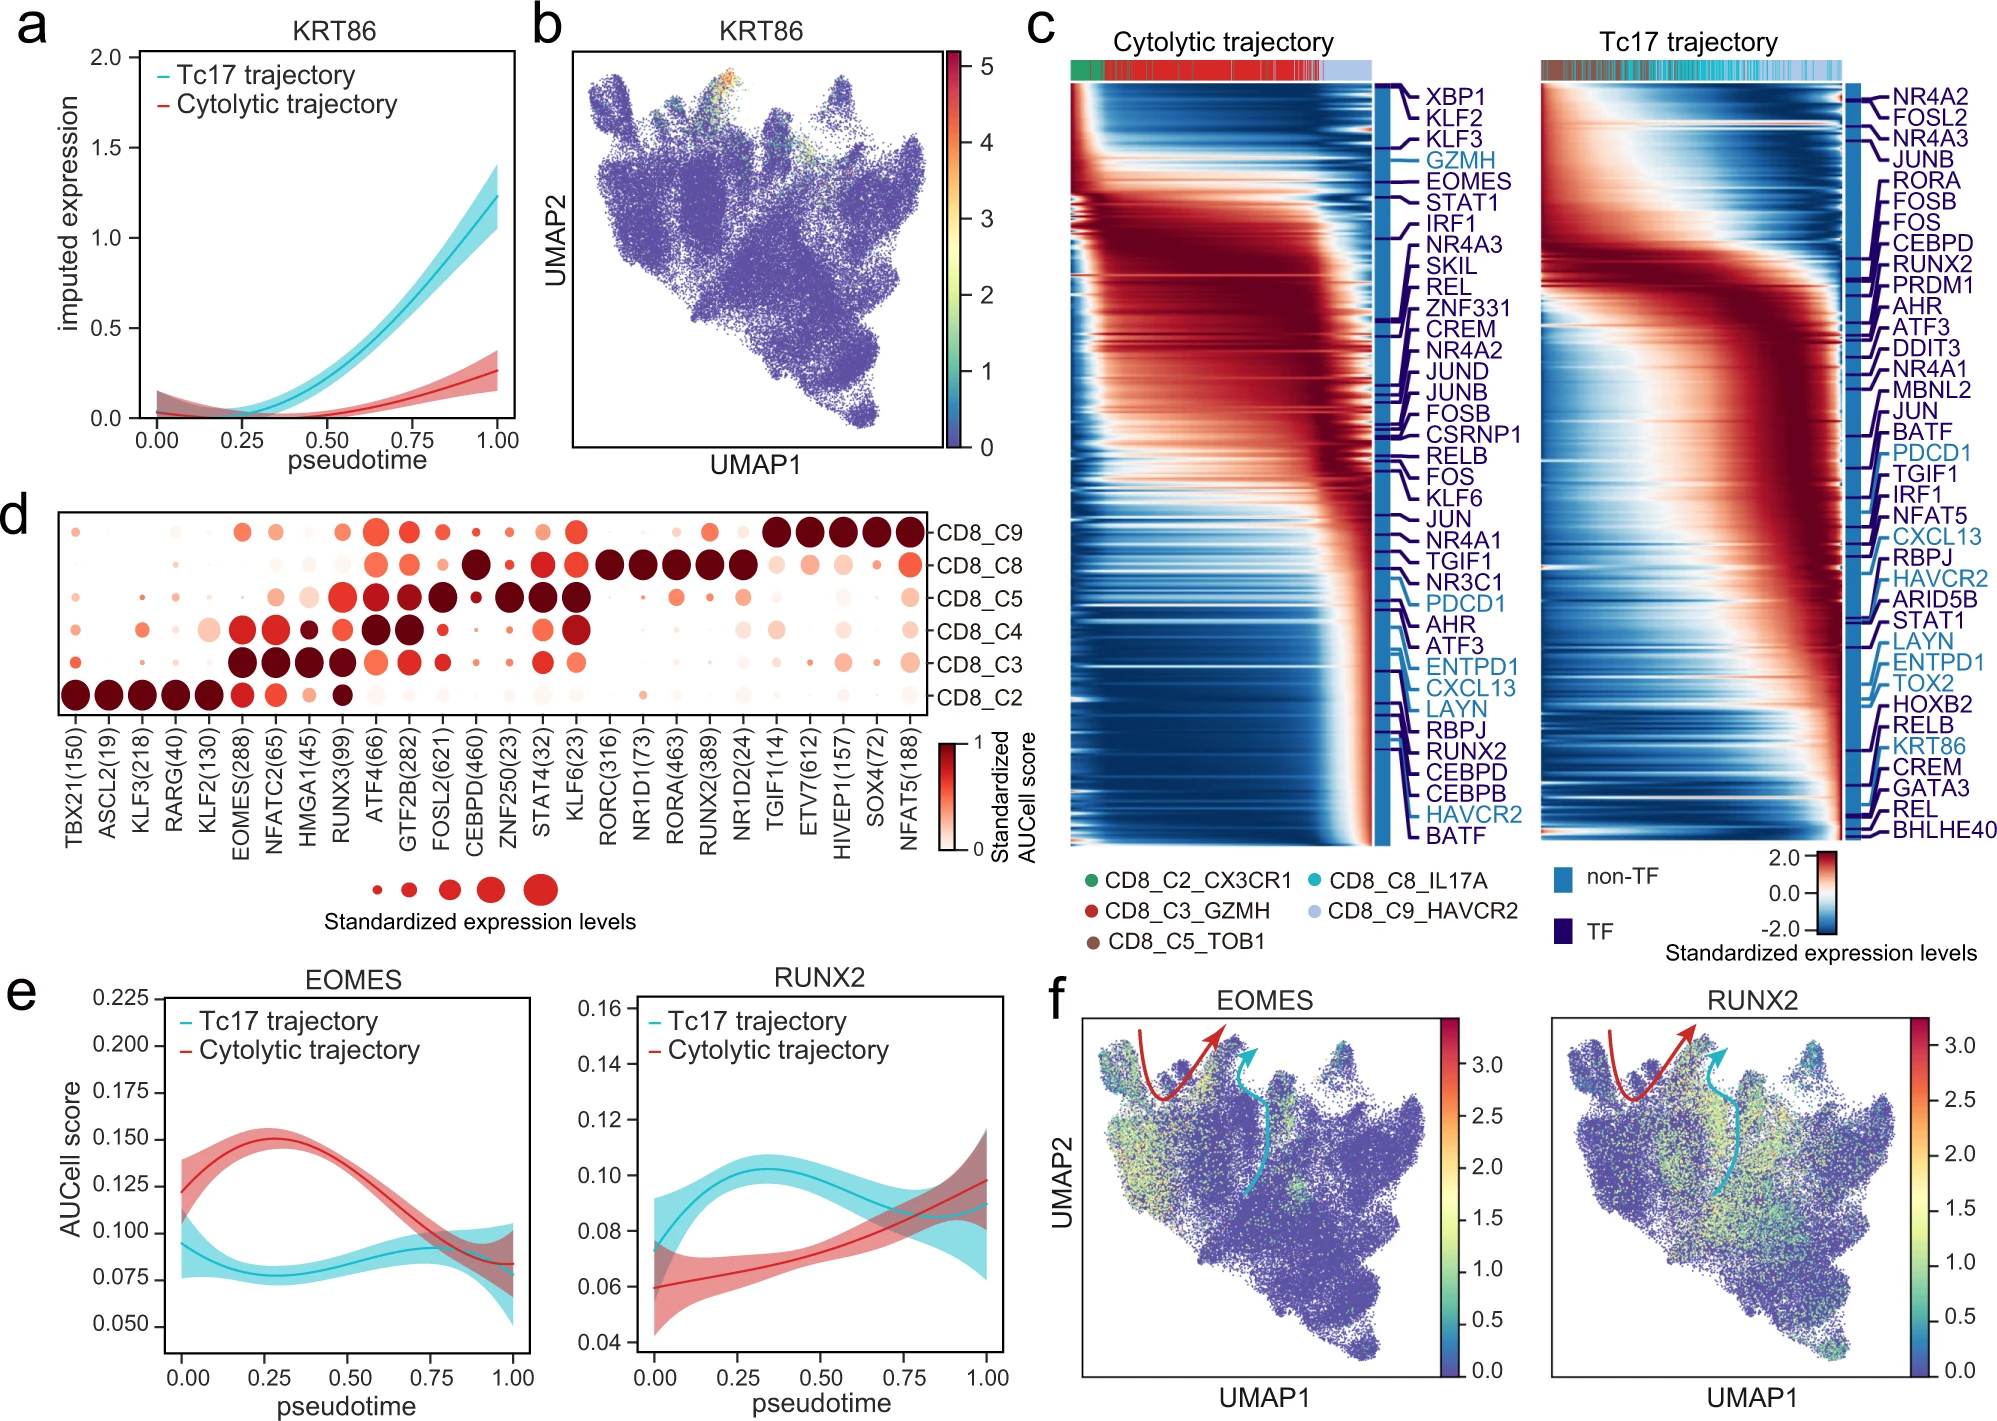
a Gaussian process regression curves with a 95% confidence interval showing the dynamic expression of KRT86 along the pseudotime of the cytolytic trajectory (excluding CD8_C4_GZMK) and the Tc17 trajectory. b UMAP showing the expression of KRT86 in T cells. c Heatmaps showing the expression of highly variable genes along the pseudotime of the cytolytic trajectory (excluding CD8_C4_GZMK) and the Tc17 trajectory. The color bar on the top represents cell clusters as in Fig. 6g; The color bar on the right annotates all the highly variable TFs and some specific marker genes. d Dot plot showing the AUCell scores of TF regulon activity calculated by SCENIC for CD8+ T-cell subsets. The size of each dot represents the standardized expression level of TFs. e Gaussian process regression curves with a 95% confidence interval showing the dynamic expression of EMOES (left)and RUNX2 (right) along the pseudotime of the cytolytic trajectory (excluding CD8_C4_GZMK) and the Tc17 trajectory. f UMAP showing the expression of EMOES (left)and RUNX2 (right) in T cells. Red and cyan arrows indicate the state transition of blood-derived and tissue-derived CD8+ T cells, respectively. Source data are provided as a Source Data file.
