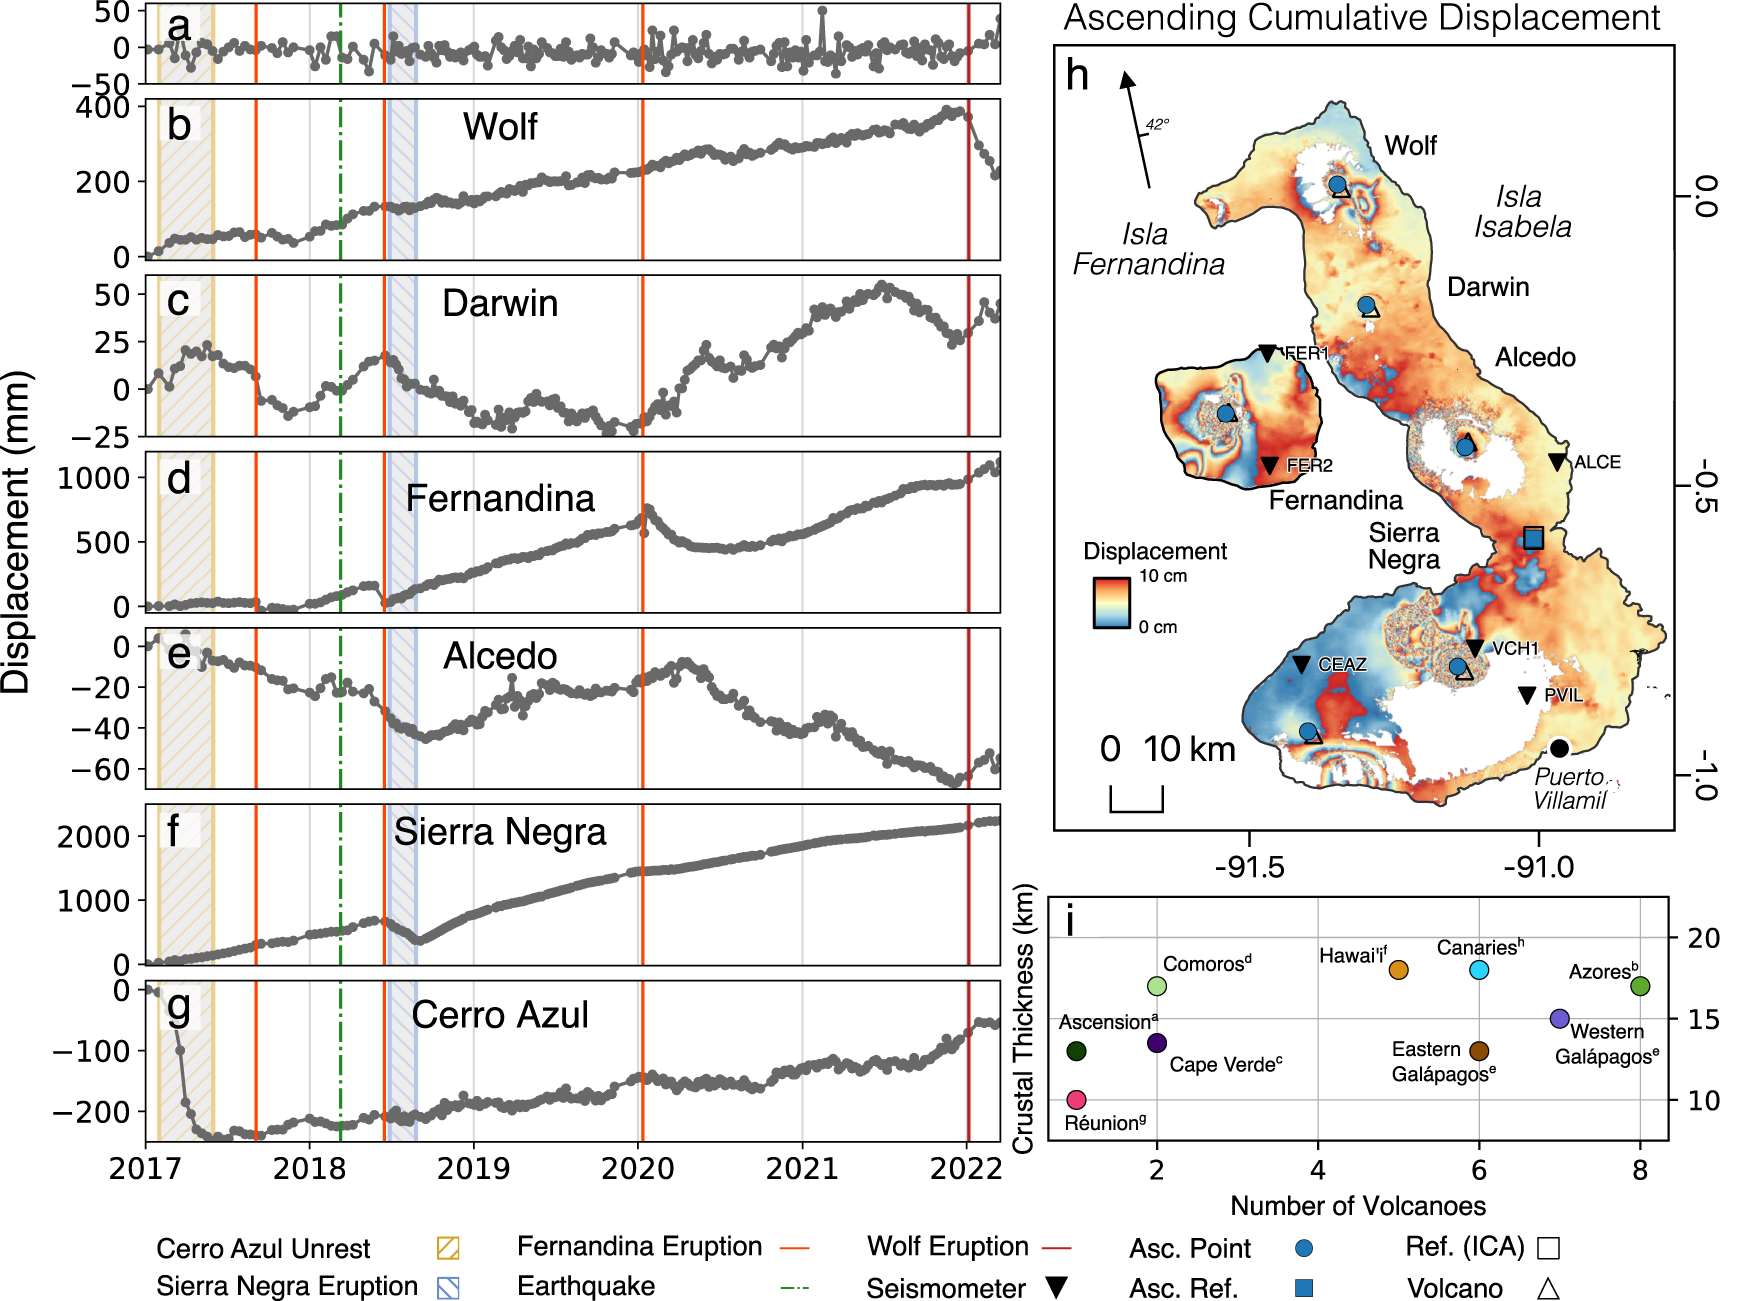
Fig. 1: Ascending Sentinel-1 cumulative displacement time series for the Western Galápagos, from 06/01/2017 to 17/03/2022.
From: Magmatic connectivity among six Galápagos volcanoes revealed by satellite geodesy

a Time series of average displacement of the reference pixel (annotated by the blue square in panel (h)). b–g Displacement time series at each of the major volcanoes of the Western Galápagos. Periods of significant unrest, including unrest at Cerro Azul and eruptions at Fernandina, Sierra Negra, and Wolf, are annotated. Displacement values may differ from previous studies due to the choice of point plotted. For example, Sierra Negra subsided by a maximum of 8 m during the 2018 eruption6, resulting in phase-decorrelation in our dataset. Therefore, we plot a point that may not capture this maximum displacement in order to prevent time series gaps. h Wrapped cumulative displacement map of the Western Galápagos across the entire time series (2017–2022). Each fringe corresponds to 10 cm of displacement in the satellite line-of-sight direction. The arrow shows the satellite heading, as well as the average incidence angle. The annotated points refer to pixels used during correlation analysis, while the reference area is used during Independent Component Analysis (Fig. 2). i Crustal thickness and number of volcanoes at oceanic hotspots. References for crustal thicknesses are as follows: a49, b50, c51, d52, e8, f53, g54, h55. Source data are provided as a Source Data file.
