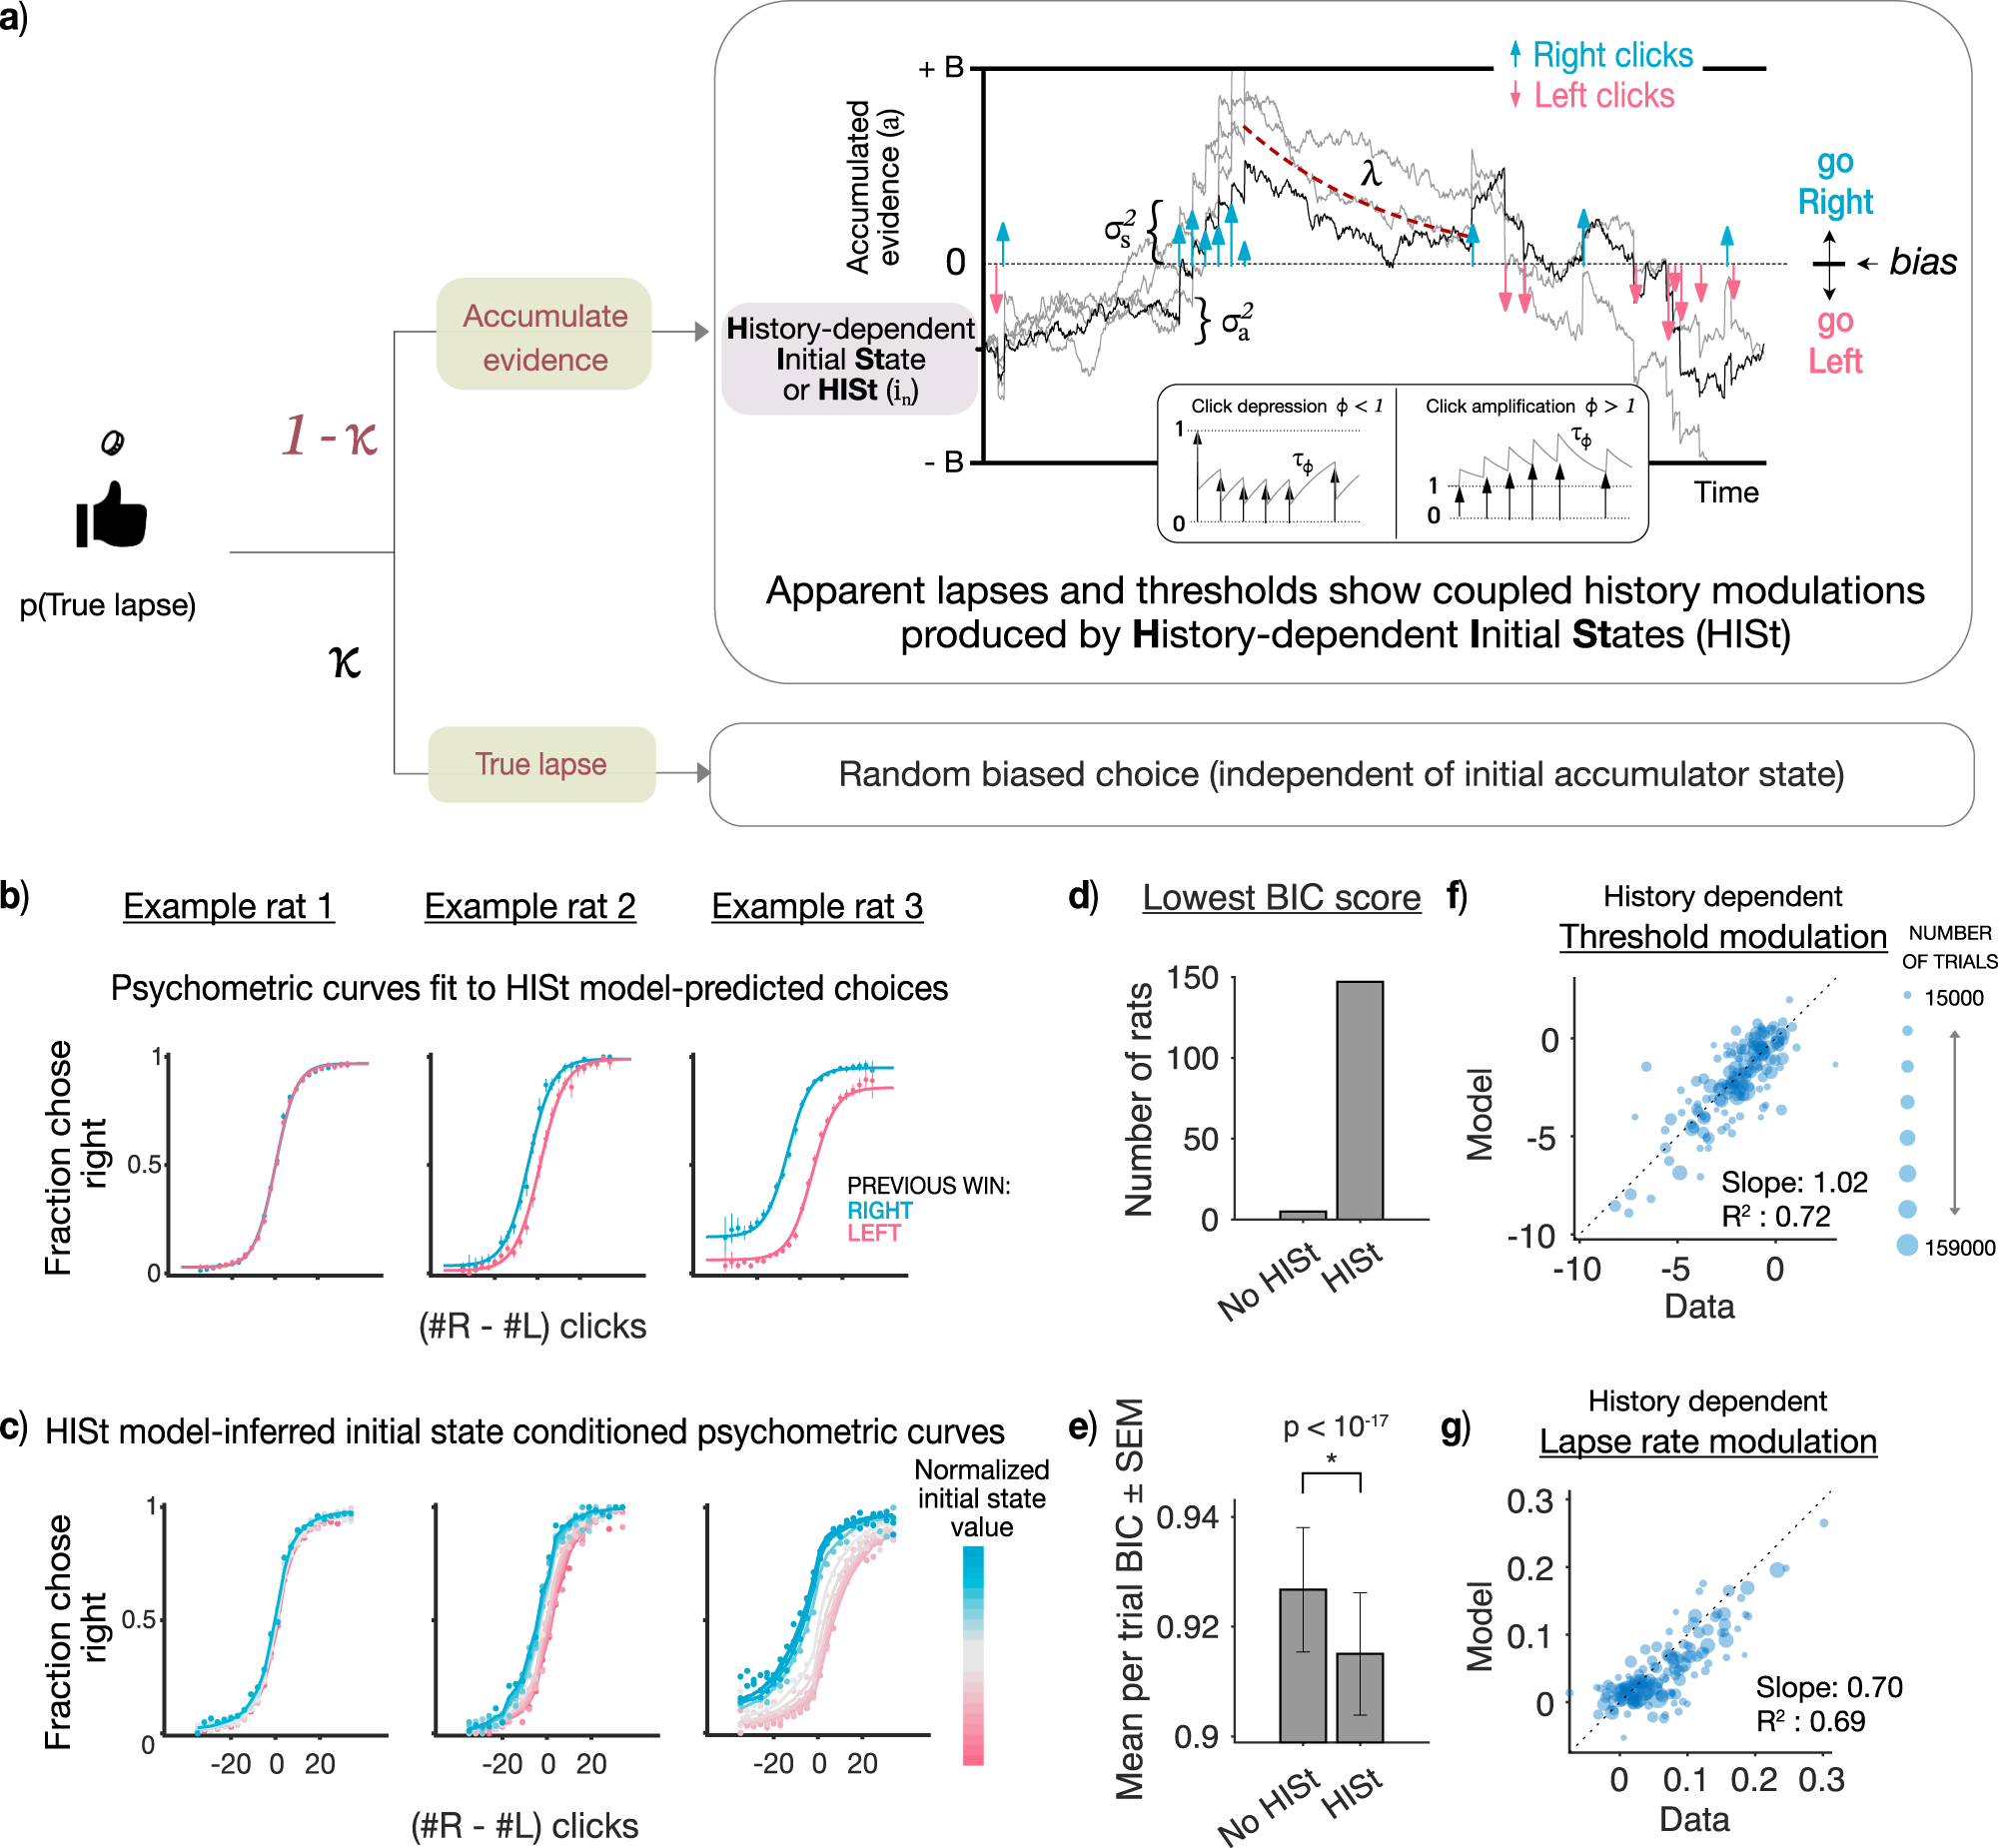
Fig. 3: History-dependent initial states capture comodulations in thresholds and lapse rates in the data.
From: Trial-history biases in evidence accumulation can give rise to apparent lapses in decision-making

a Schematic of the model used to fit rat data in the Poisson Clicks task. (Top): The model consists of trial history-dependent initial states (HISt) that can produce history-dependent apparent lapses and threshold modulations. Additionally, the model consists of sensory noise (\({\sigma }_{s}^{2}\)) in click magnitudes, adaptation of successive click magnitudes based on an adaptation scale (ϕ) and timescale (τϕ), accumulator noise (\({\sigma }_{a}^{2}\)), leak in the accumulator (λ), and decision bounds +/–B30. (Bottom): On κ fraction of trials, the model chooses a random action with some bias (ρ) reflecting motor errors or random exploration. These true lapses are not modulated by history, such that any history modulations arise from the initial states alone. (Figure adapted with permission from Bingni W. Brunton et al., Rats and Humans Can Optimally Accumulate Evidence for Decision Making. Science 340,95-98(2013). DOI:10.1126/science.1233912) b Model fits to individual rats: Psychometric data (mean accuracy ± 95% binomial confidence intervals) from 3 example rats conditioned on previous rightward (blue) or leftward (wins), overlaid on model-predicted psychometric curves (solid line) from the accumulation with HISt model. (n = [16946, 20577] trials for example 1, [8568, 9549] trials for example 2, [29358, 30821] trials for example 3 for psychometric curves conditioned on [right, left wins]) c: Psychometric curves (solid line) from the same example rats conditioned on model-inferred initial states (colors from pink to blue). d Distribution of best fitting models for individual rats: e Model comparison using BIC by pooling per trial BIC score across rats and computing mean (n = 152). Mean of per trial BIC scores across rats were significantly lower for model with HISt (p = 9.85 × 10⁻¹⁸, one-sided paired t-test) indicating better fits. Error bars are SEM. For individual data points see Supplementary Fig. 6f Individual variations in history modulations captured by the accumulator model with HISt: History modulations of threshold parameters measured from psychometric fits to the raw data (x-axis) v.s. model predictions (y-axis). Individual points represent individual rats (n = 152), point sizes indicate number of trials. g same as (f) but for history-dependent lapse rate modulations.
