
Fig. 1: Illustration of the two functionalities of scDEED.
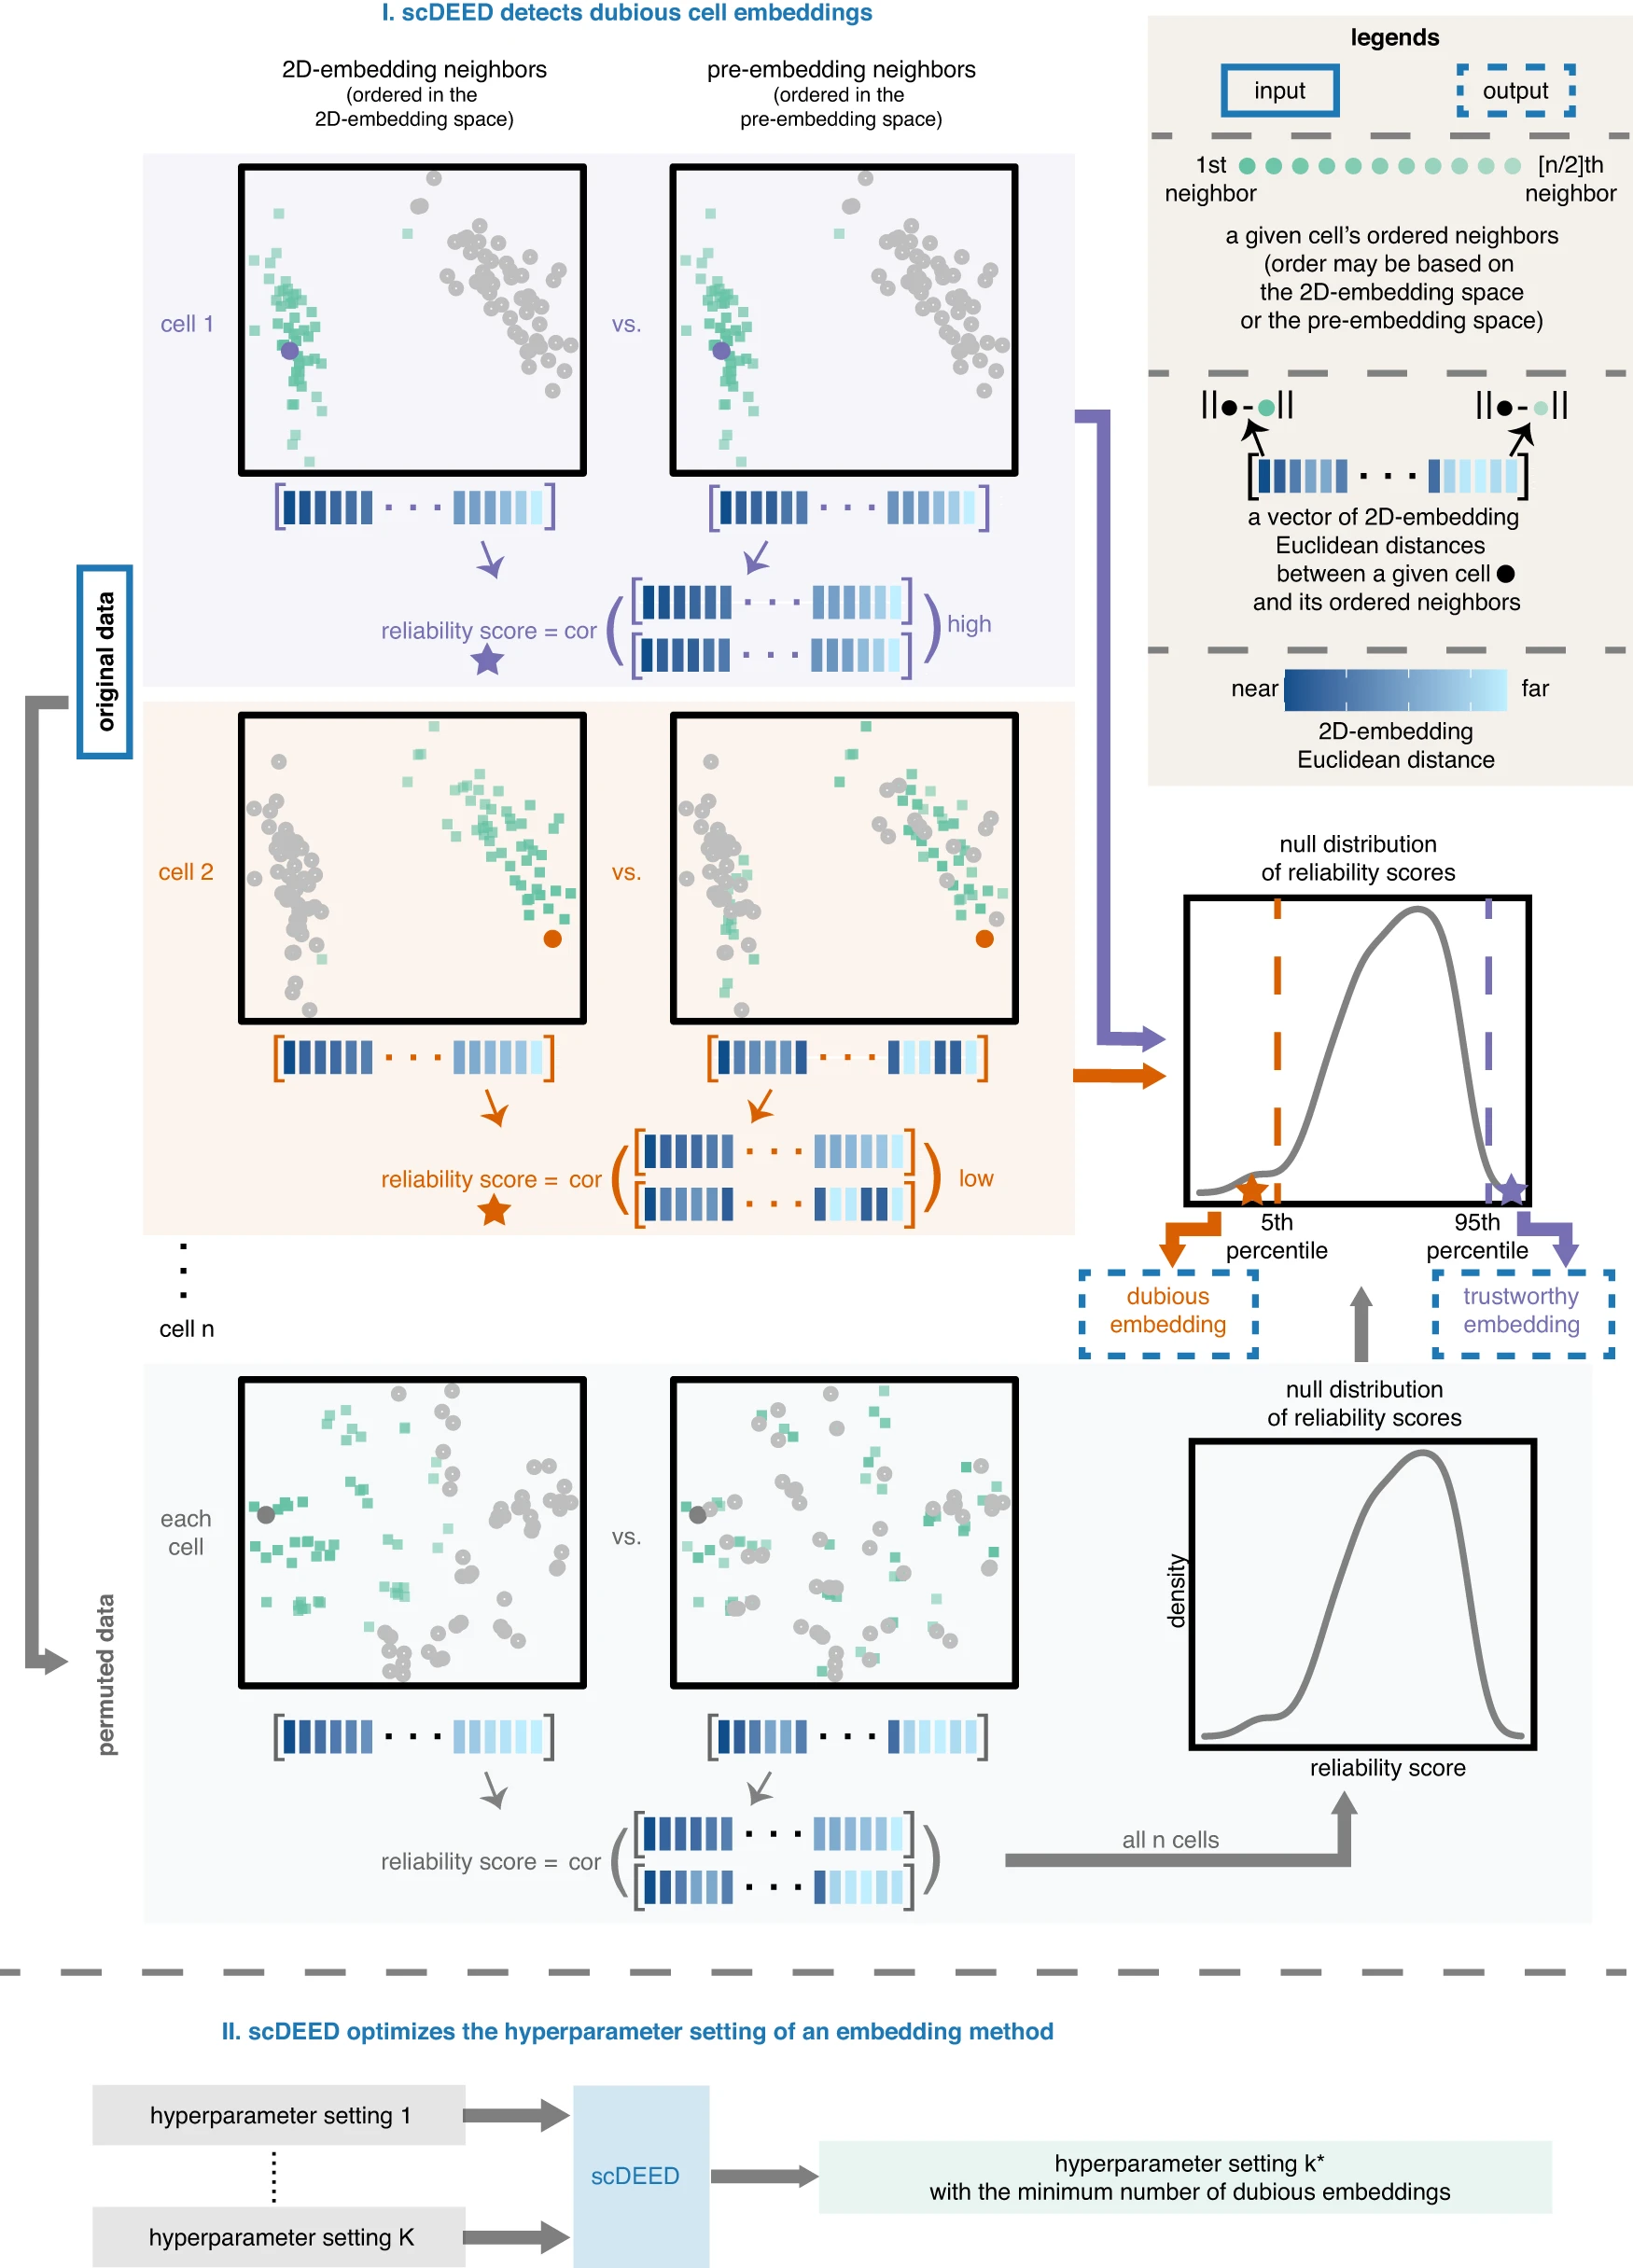
Functionality I decides whether each cell has a trustworthy or dubious embedding by calculating a reliability score, which is defined as the Pearson correlation between the cell’s distances to its closest 50% neighboring cells in the 2D-embedding space and the same cell’s distances to its closest 50% neighboring cells in the pre-embedding space (with the distances in each space ordered from the 1st neighbor to the [n/2]th neighbor, where n is the total number of cells). Compared with a null distribution of reliability scores, obtained through permutation, cell 1’s reliability score (marked by the purple star) falls into the highest 5%, so it has a trustworthy embedding; in contrast, cell 2’s reliability score (marked by the orange star) falls into the lowest 5%, so it has a dubious embedding. Enabled by functionality I, functionality II optimizes the hyperparameter setting of an embedding method (e.g., t-SNE or UMAP) by minimizing the number of dubious embeddings.
