
Fig. 10: Original t-SNE and UMAP embeddings and embeddings optimized by scDEED on the Human PBMC dataset.
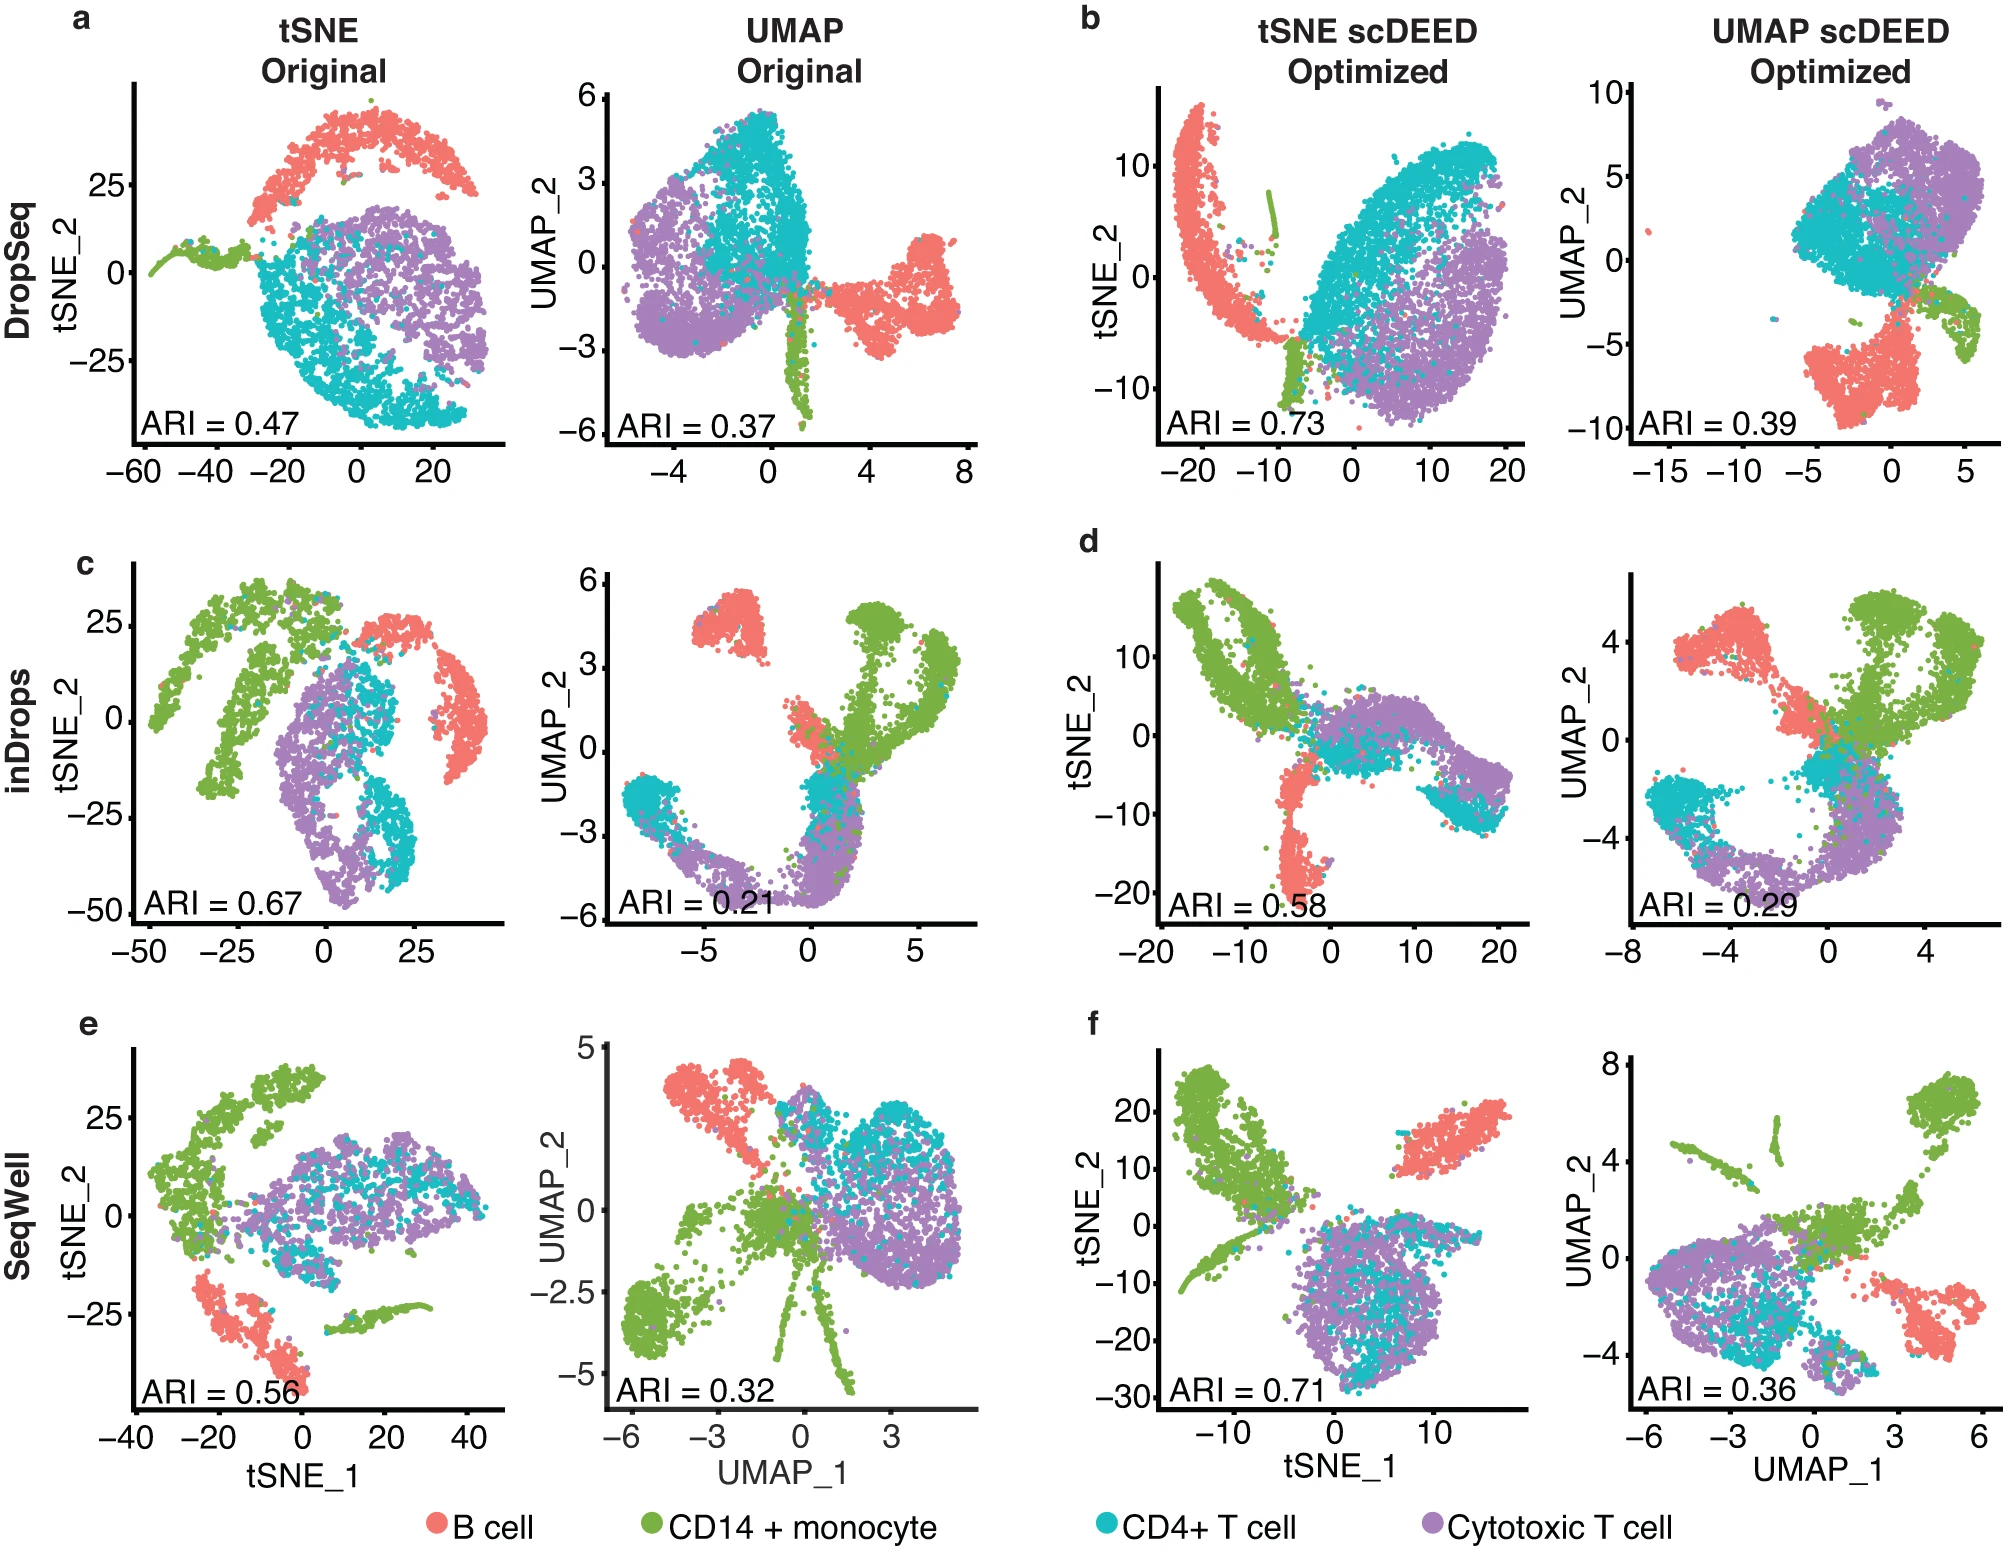
a t-SNE and UMAP plots for the DropSeq dataset at the original hyperparameters, perplexity = 30 (left) and min.dist = 0.3 and n.neighbors = 30 (right). b t-SNE and UMAP plots for the Dropseq dataset at the hyperparameters optimized by scDEED, perplexity = 290 (left) and min.dist = 0.5 and n.neighbors = 5 (right). c t-SNE and UMAP plots for the inDrops dataset at the original hyperparameters, perplexity = 30 (left) and min.dist = 0.3 and n.neighbors = 30 (right). d t-SNE and UMAP plots for the inDrops dataset at the hyperparameters optimized by scDEED, perplexity = 320 (left) and min.dist = 0.5 and n.neighbors = 80 (right). e t-SNE and UMAP plots for the SeqWell dataset at the original hyperparameters, perplexity = 30 (left) and min.dist = 0.3 and n.neighbors = 30 (right). f t-SNE and UMAP plots for the SeqWell dataset at the hyperparameters optimized by scDEED, perplexity = 140 (left) and min.dist = 0.2 and n.neighbors = 7 (right). Applying spectral clustering to identify cell clusters of the same number as the cell types in each set of embeddings, we found that in five out of six cases (three scRNA-seq technologies with t-SNE and UMAP embeddings), the optimized embeddings led to a higher adjusted Rand index (ARI) than the original embeddings, suggesting that the optimized embeddings better represented the cell types.
