
Fig. 2: Original t-SNE embeddings and t-SNE embeddings optimized by scDEED on the Hydra dataset.
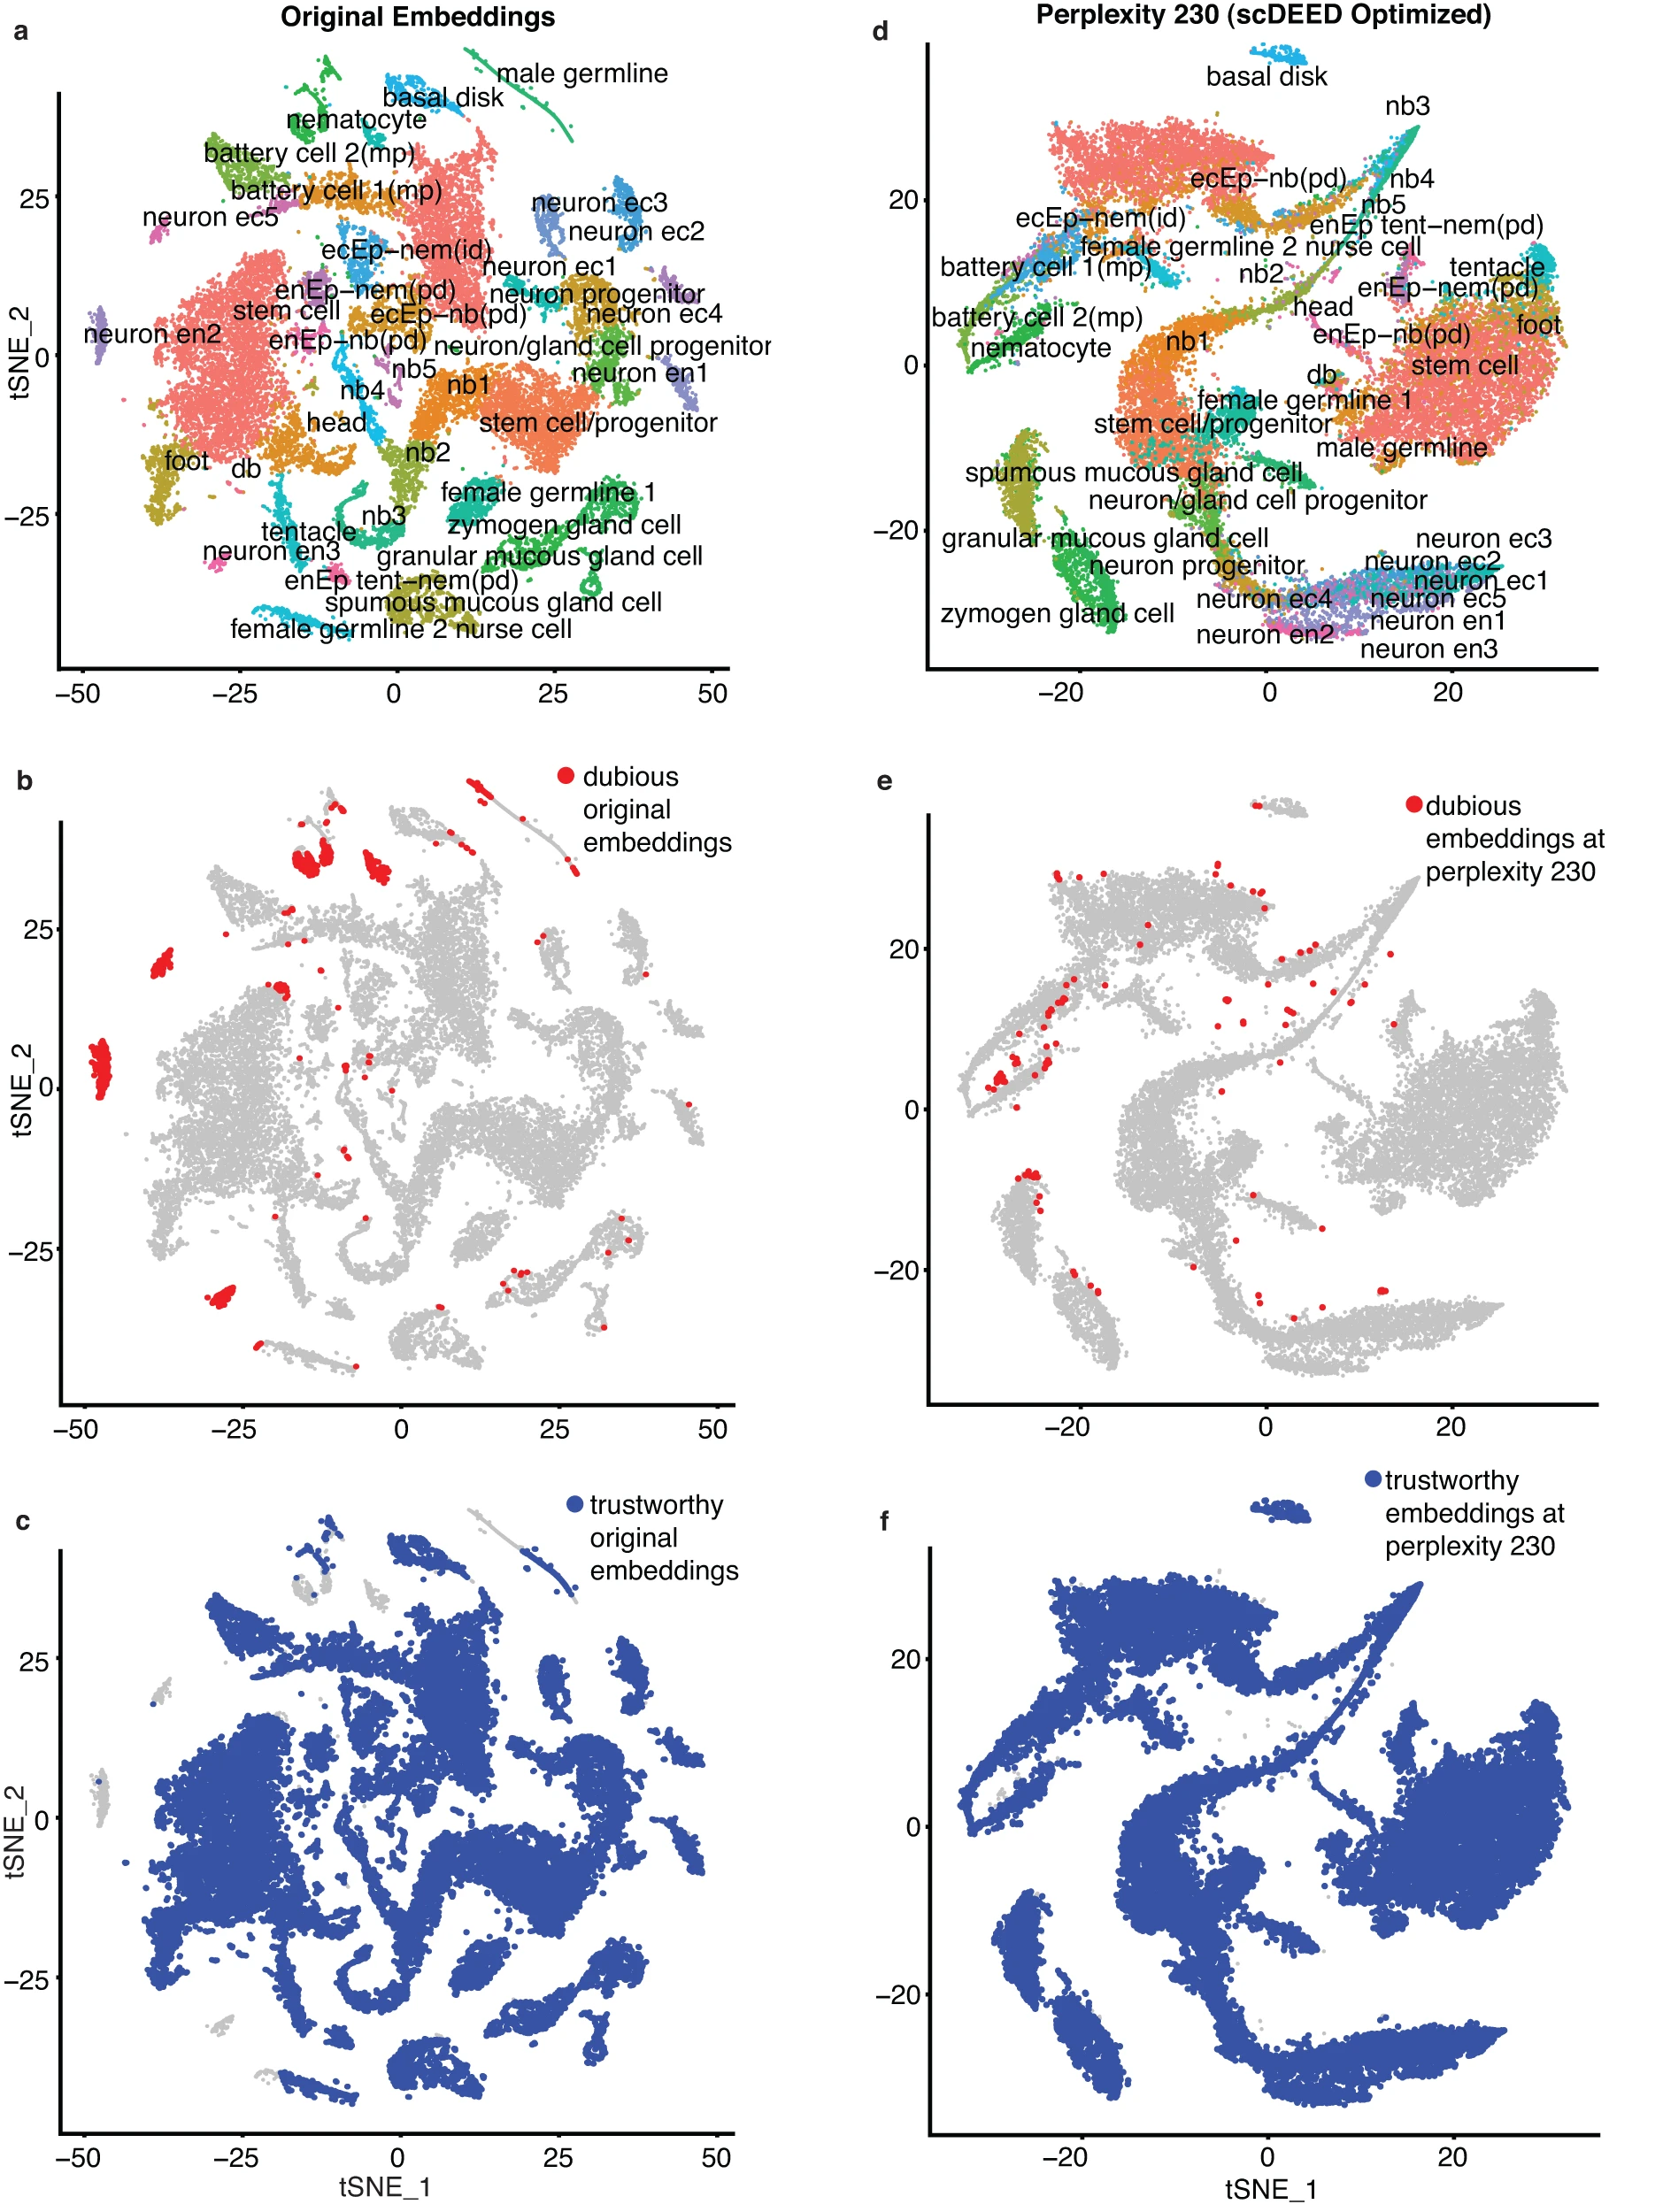
a t-SNE plot of the Hydra dataset at the perplexity 40 used in the original study. b–c Dubious cell embeddings (b) and trustworthy cell embeddings (c) defined by scDEED at the perplexity 40. d t-SNE plot of the Hydra dataset at the perplexity 230 optimized by scDEED. e–f Dubious cell embeddings (e) and trustworthy cell embeddings (f) defined by scDEED at the perplexity 230.
