
Fig. 3: Evaluation of t-SNE embeddings optimized by scDEED on the Hydra dataset.
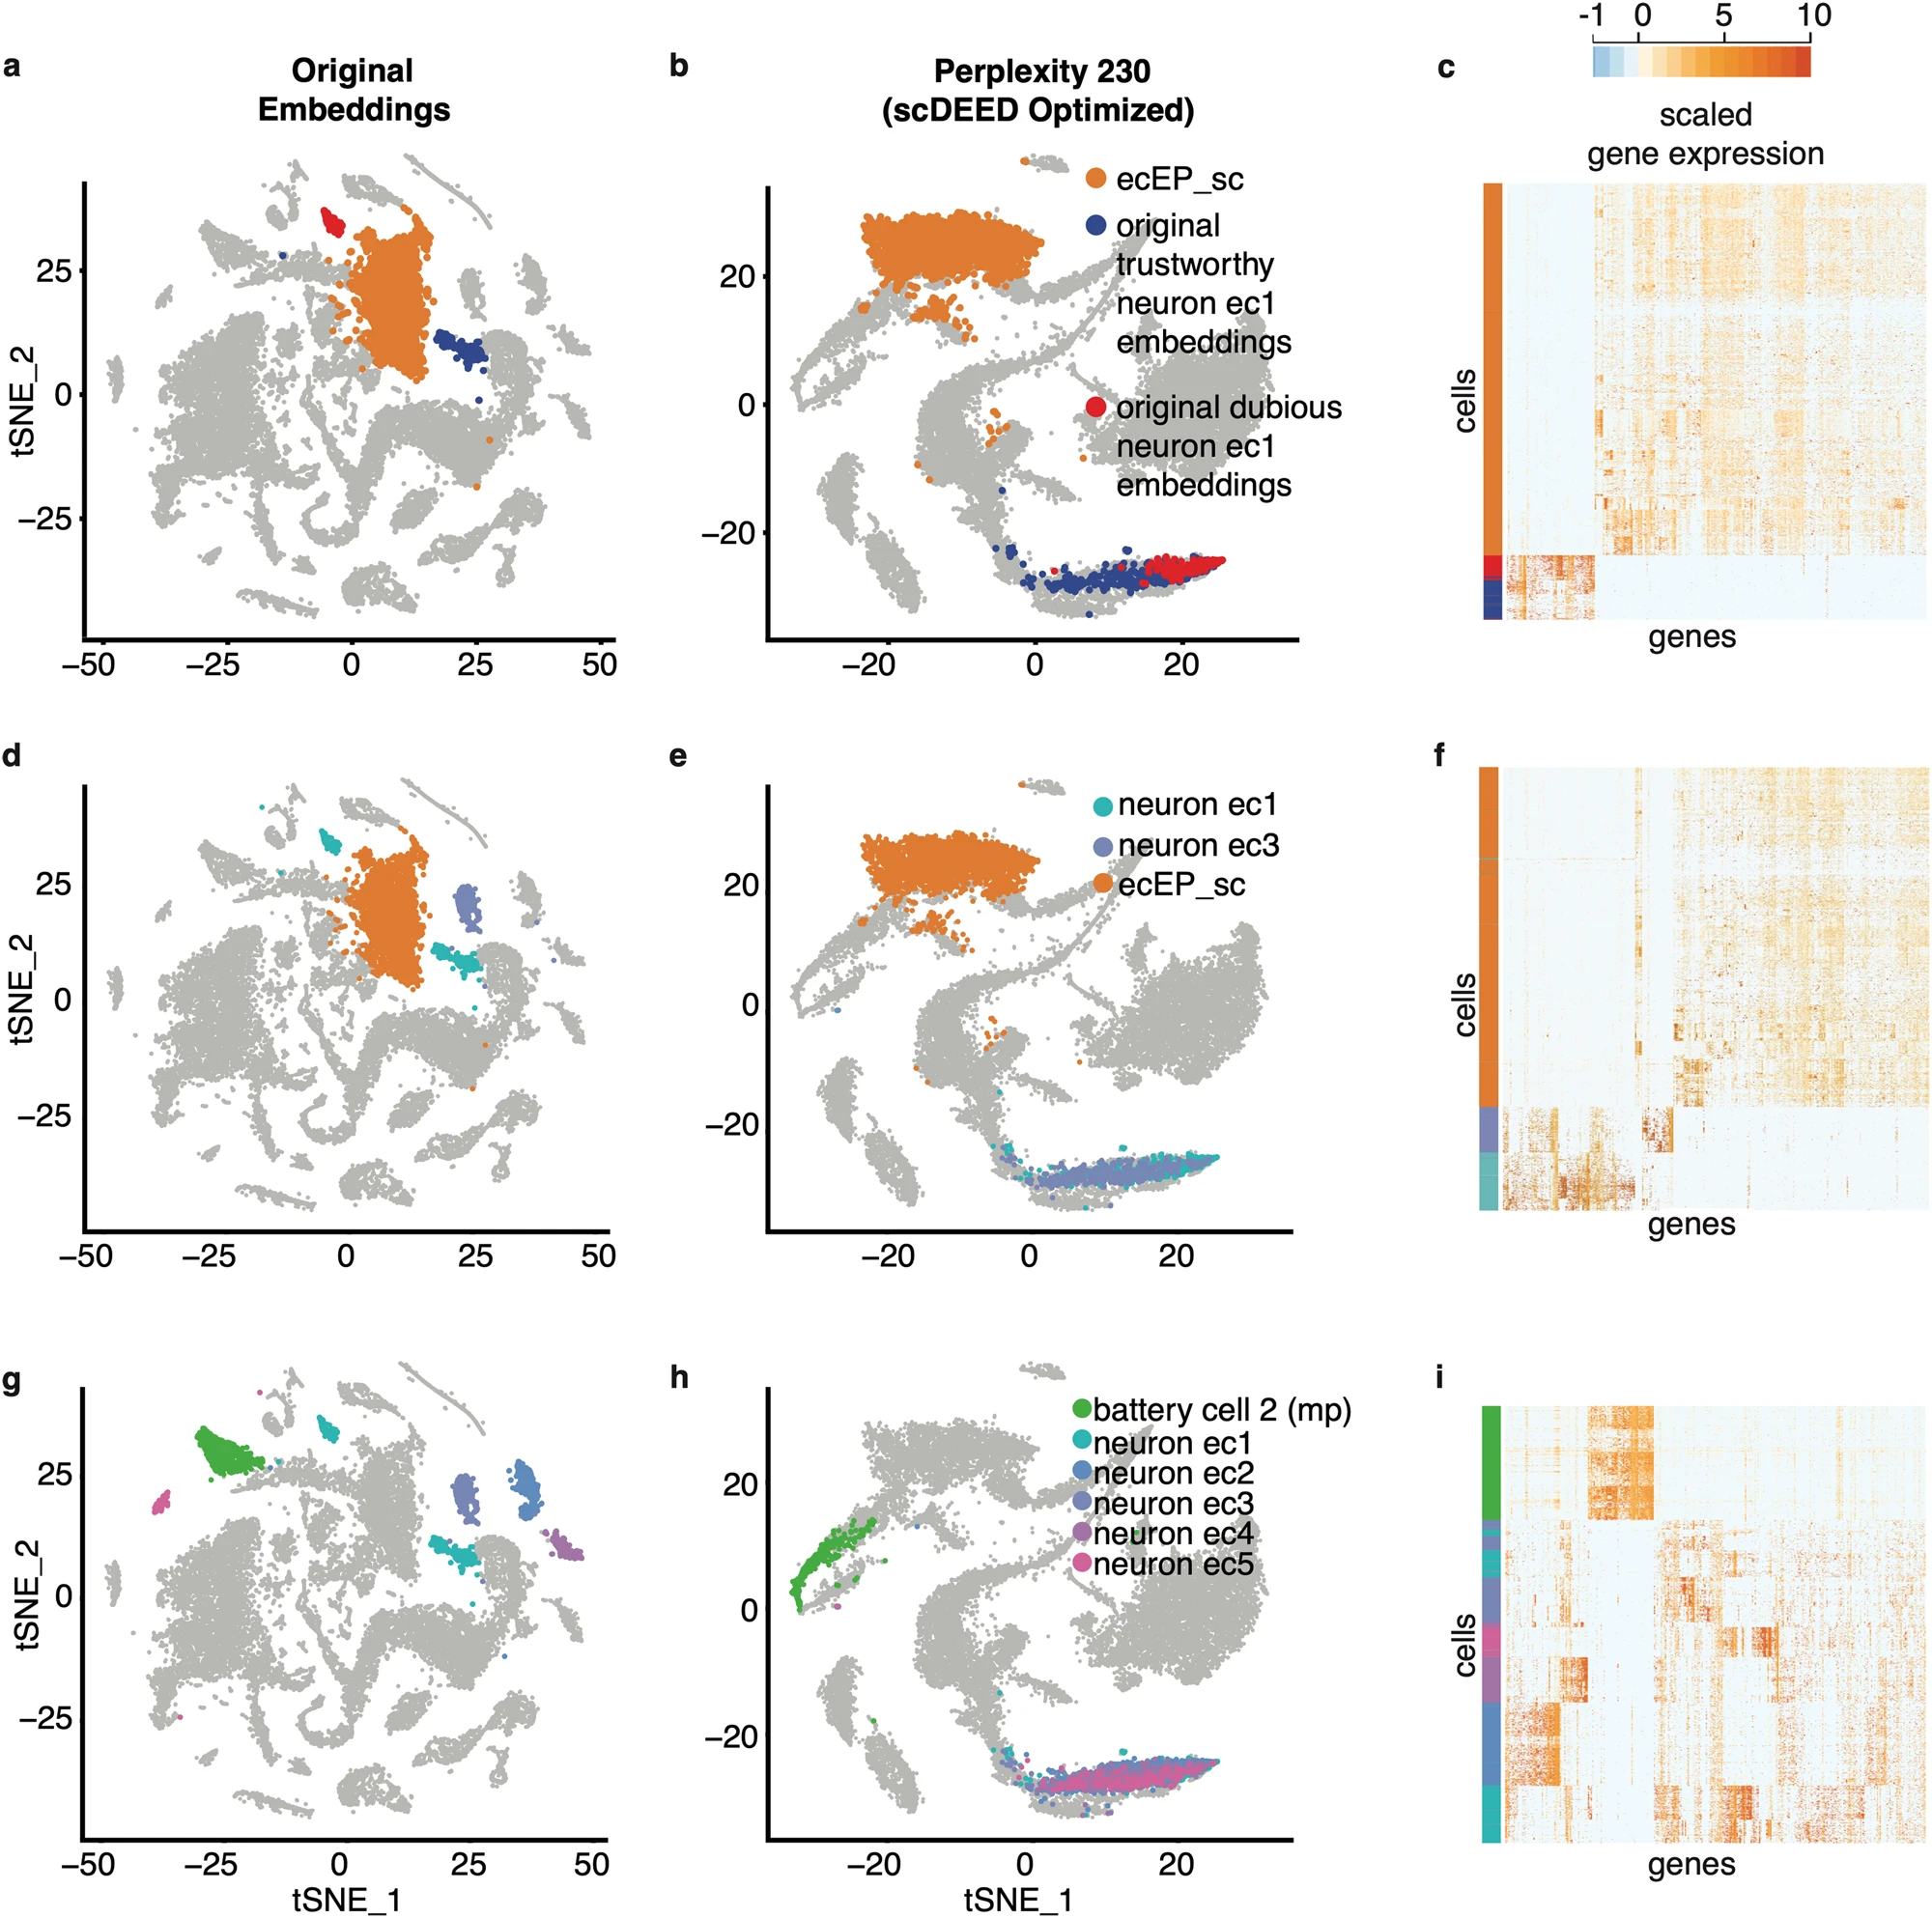
a–b Comparative t-SNE plots with the ecEP_sc (ectodermal epithelial_single cell), trustworthy cell embeddings in neuron ec1, and dubious cell embeddings in neuron ec1 highlighted, at the original perplexity 40 (a) and the perplexity 230 optimized by scDEED (b). c Gene expression heatmap of the highlighted cells in (a) and (b), where the cells are ordered by the default hierarchical clustering found by the R function heatmap.2(). d–e Comparative t-SNE plots with the neuron ec1, neuron ec3, and ecEP_sc cells highlighted. At the original perplexity 40 (d), the neuron ec1 cells are in two separate clusters and have similarly short distances as the neuron ec3 cells have to the ecEP_sc cells; at the optimized perplexity 230 (e), the neuron ec1 and neuron ec3 cells are unified as one cluster far away from the ecEP_sc cells. f Gene expression heatmaps of the highlighted cells in (d) and (e), where the cells are ordered by the default hierarchical clustering found by the R function heatmap.2(). g–h Comparative t-SNE plots with the neuron ec1, neuron ec2, neuron ec3, neuron ec4, neuron ec5, and battery cell 2 (mp) cells highlighted. At the original perplexity 40 (g), the neuron ec1, neuron ec2, neuron ec3, neuron ec4, and neuron ec5 cells are in distinct clusters surrounding the battery cell 2 (mp) cells; at the optimized perplexity 210 (h), the five neuron ec clusters are unified as one cluster far away from the battery cell 2 (mp) cells. i Gene expression heatmap of the highlighted cells in (g) and (h), where the cells are ordered by the default hierarchical clustering found by the R function heatmap.2().
