
Fig. 4: Original t-SNE embeddings and t-SNE embeddings optimized by scDEED on the CAR-T dataset.
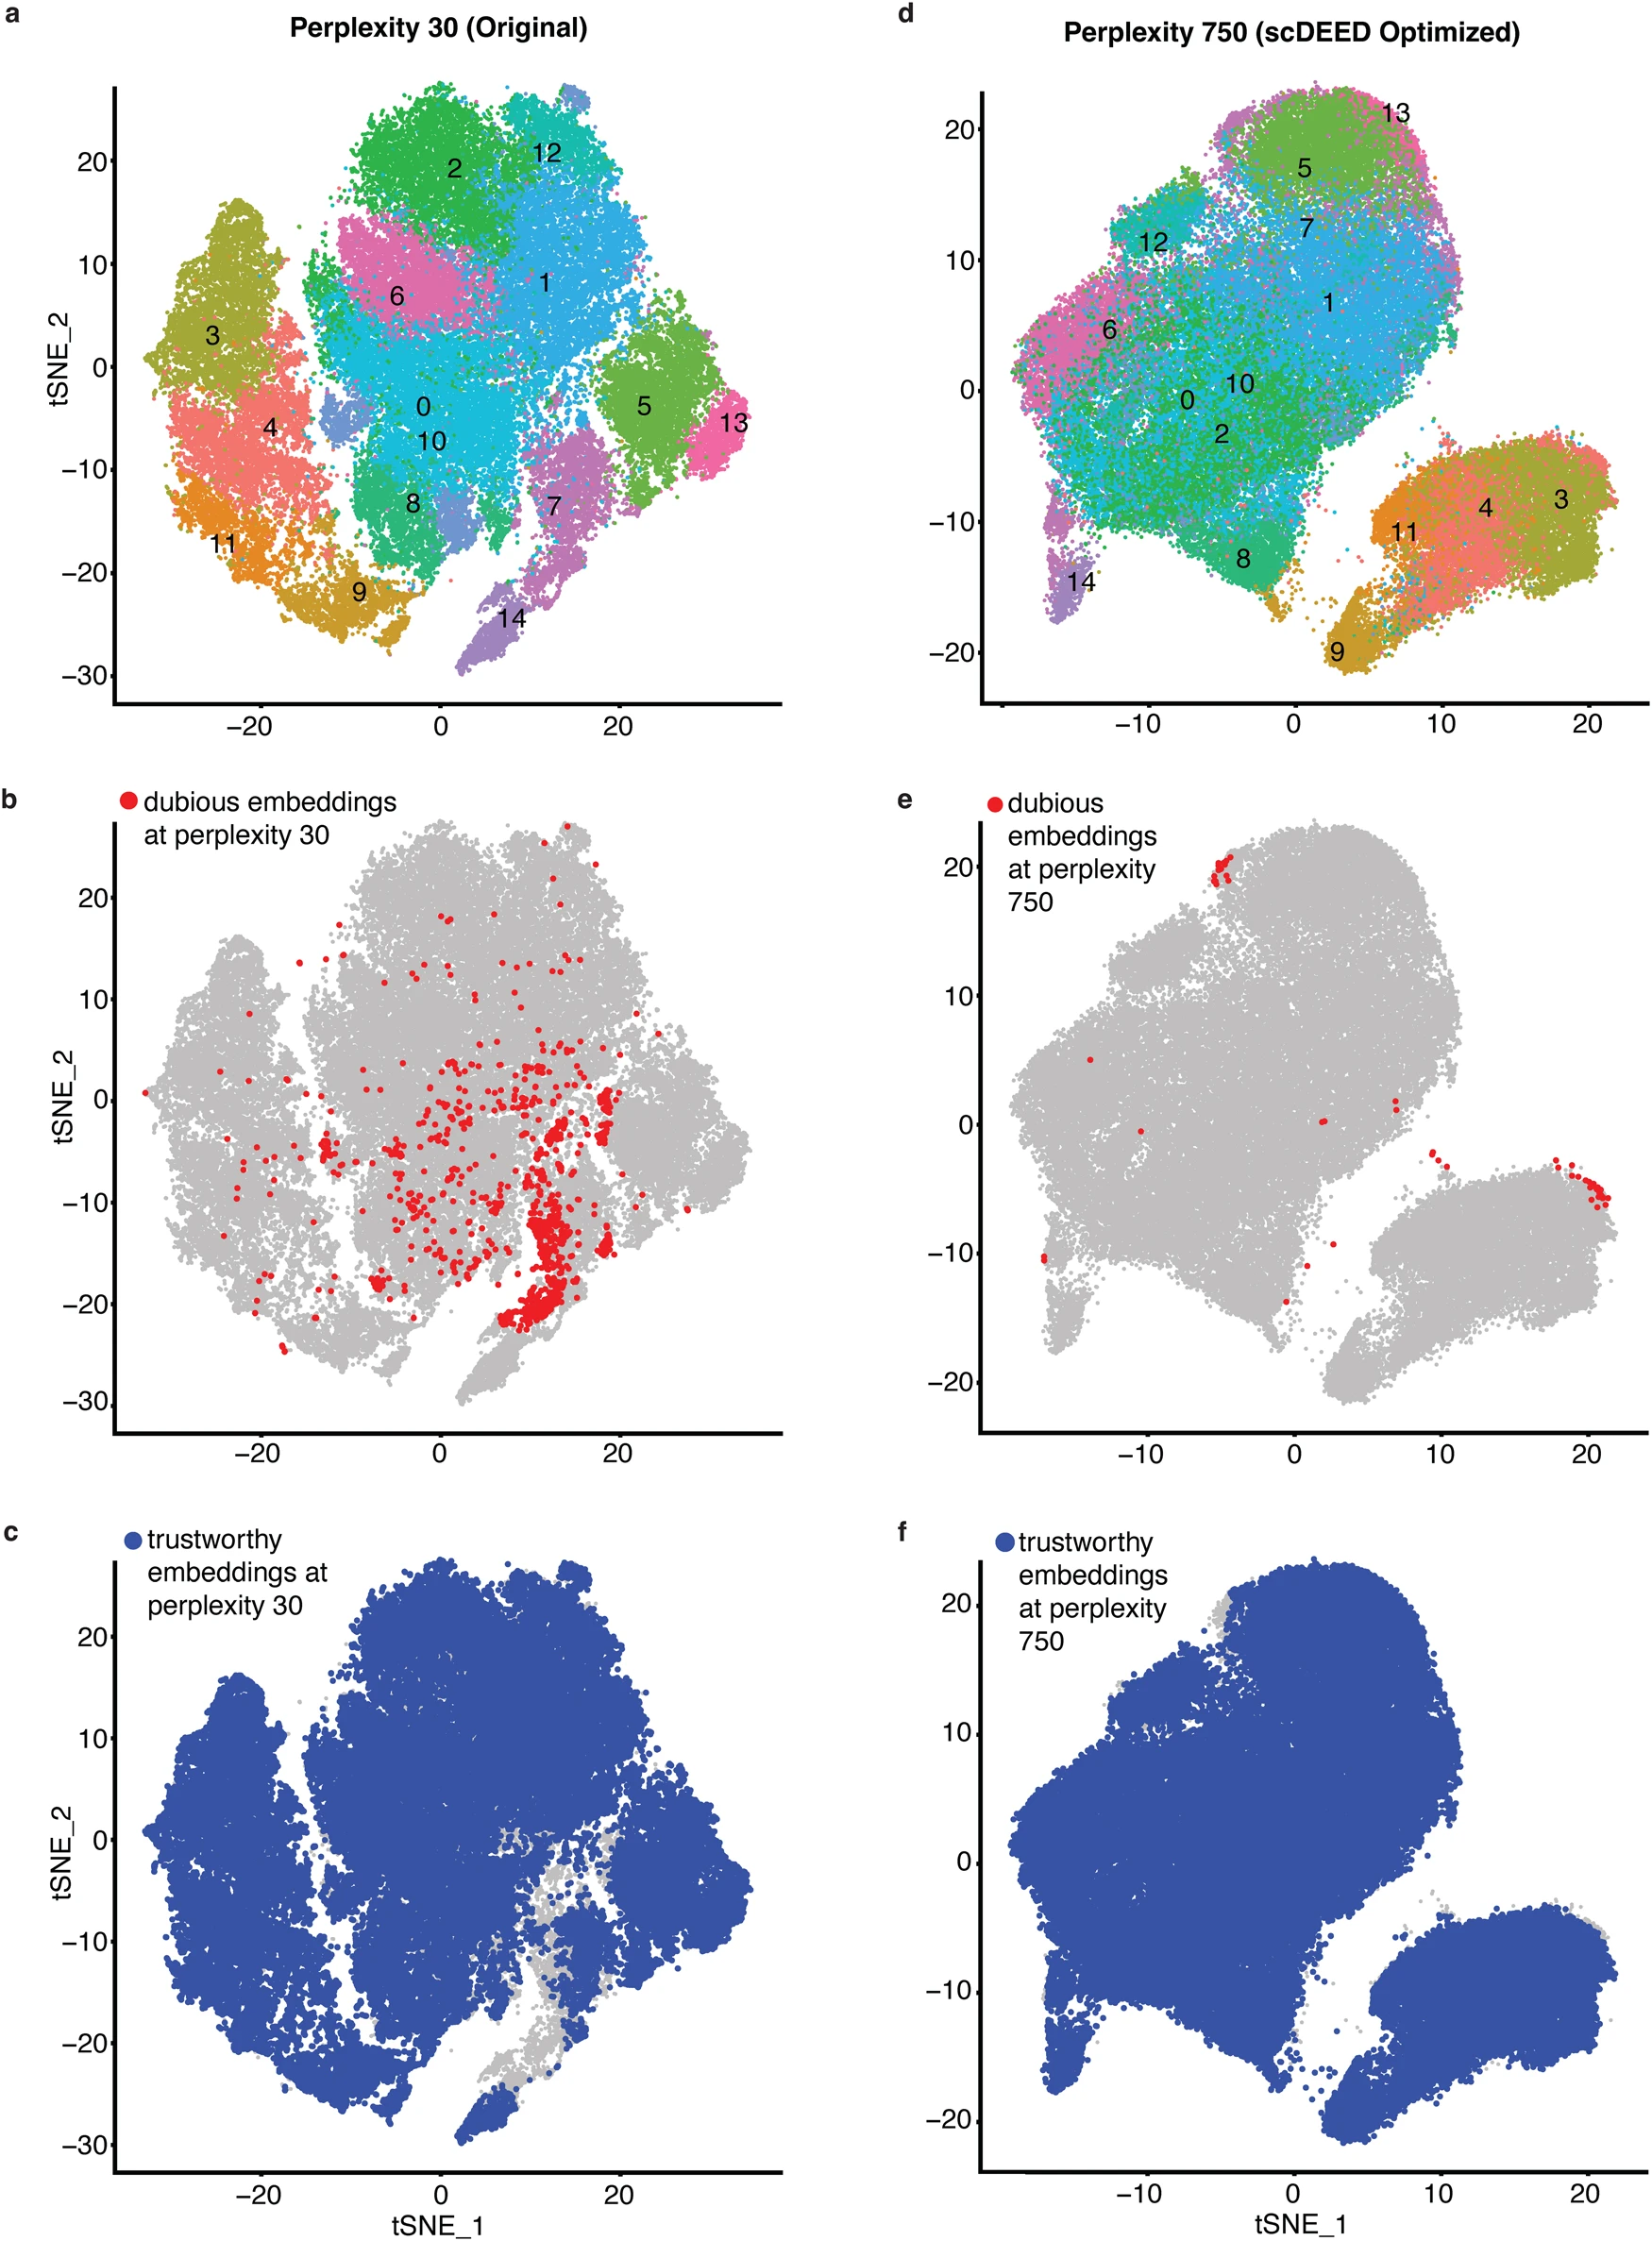
a t-SNE plot of the CAR-T dataset at the study’s original perplexity 30. Dubious embeddings (b) and trustworthy embeddings (c) defined by scDEED at the original perplexity 30. d t-SNE plot of the CAR-T dataset at the perplexity 750 optimized by scDEED. Dubious embeddings (e) and trustworthy embeddings (f) defined by scDEED at the optimized perplexity 750.
