
Fig. 5: Evaluation of cluster locations at the original t-SNE perplexity and the perplexity optimized by scDEED on the CAR-T dataset.
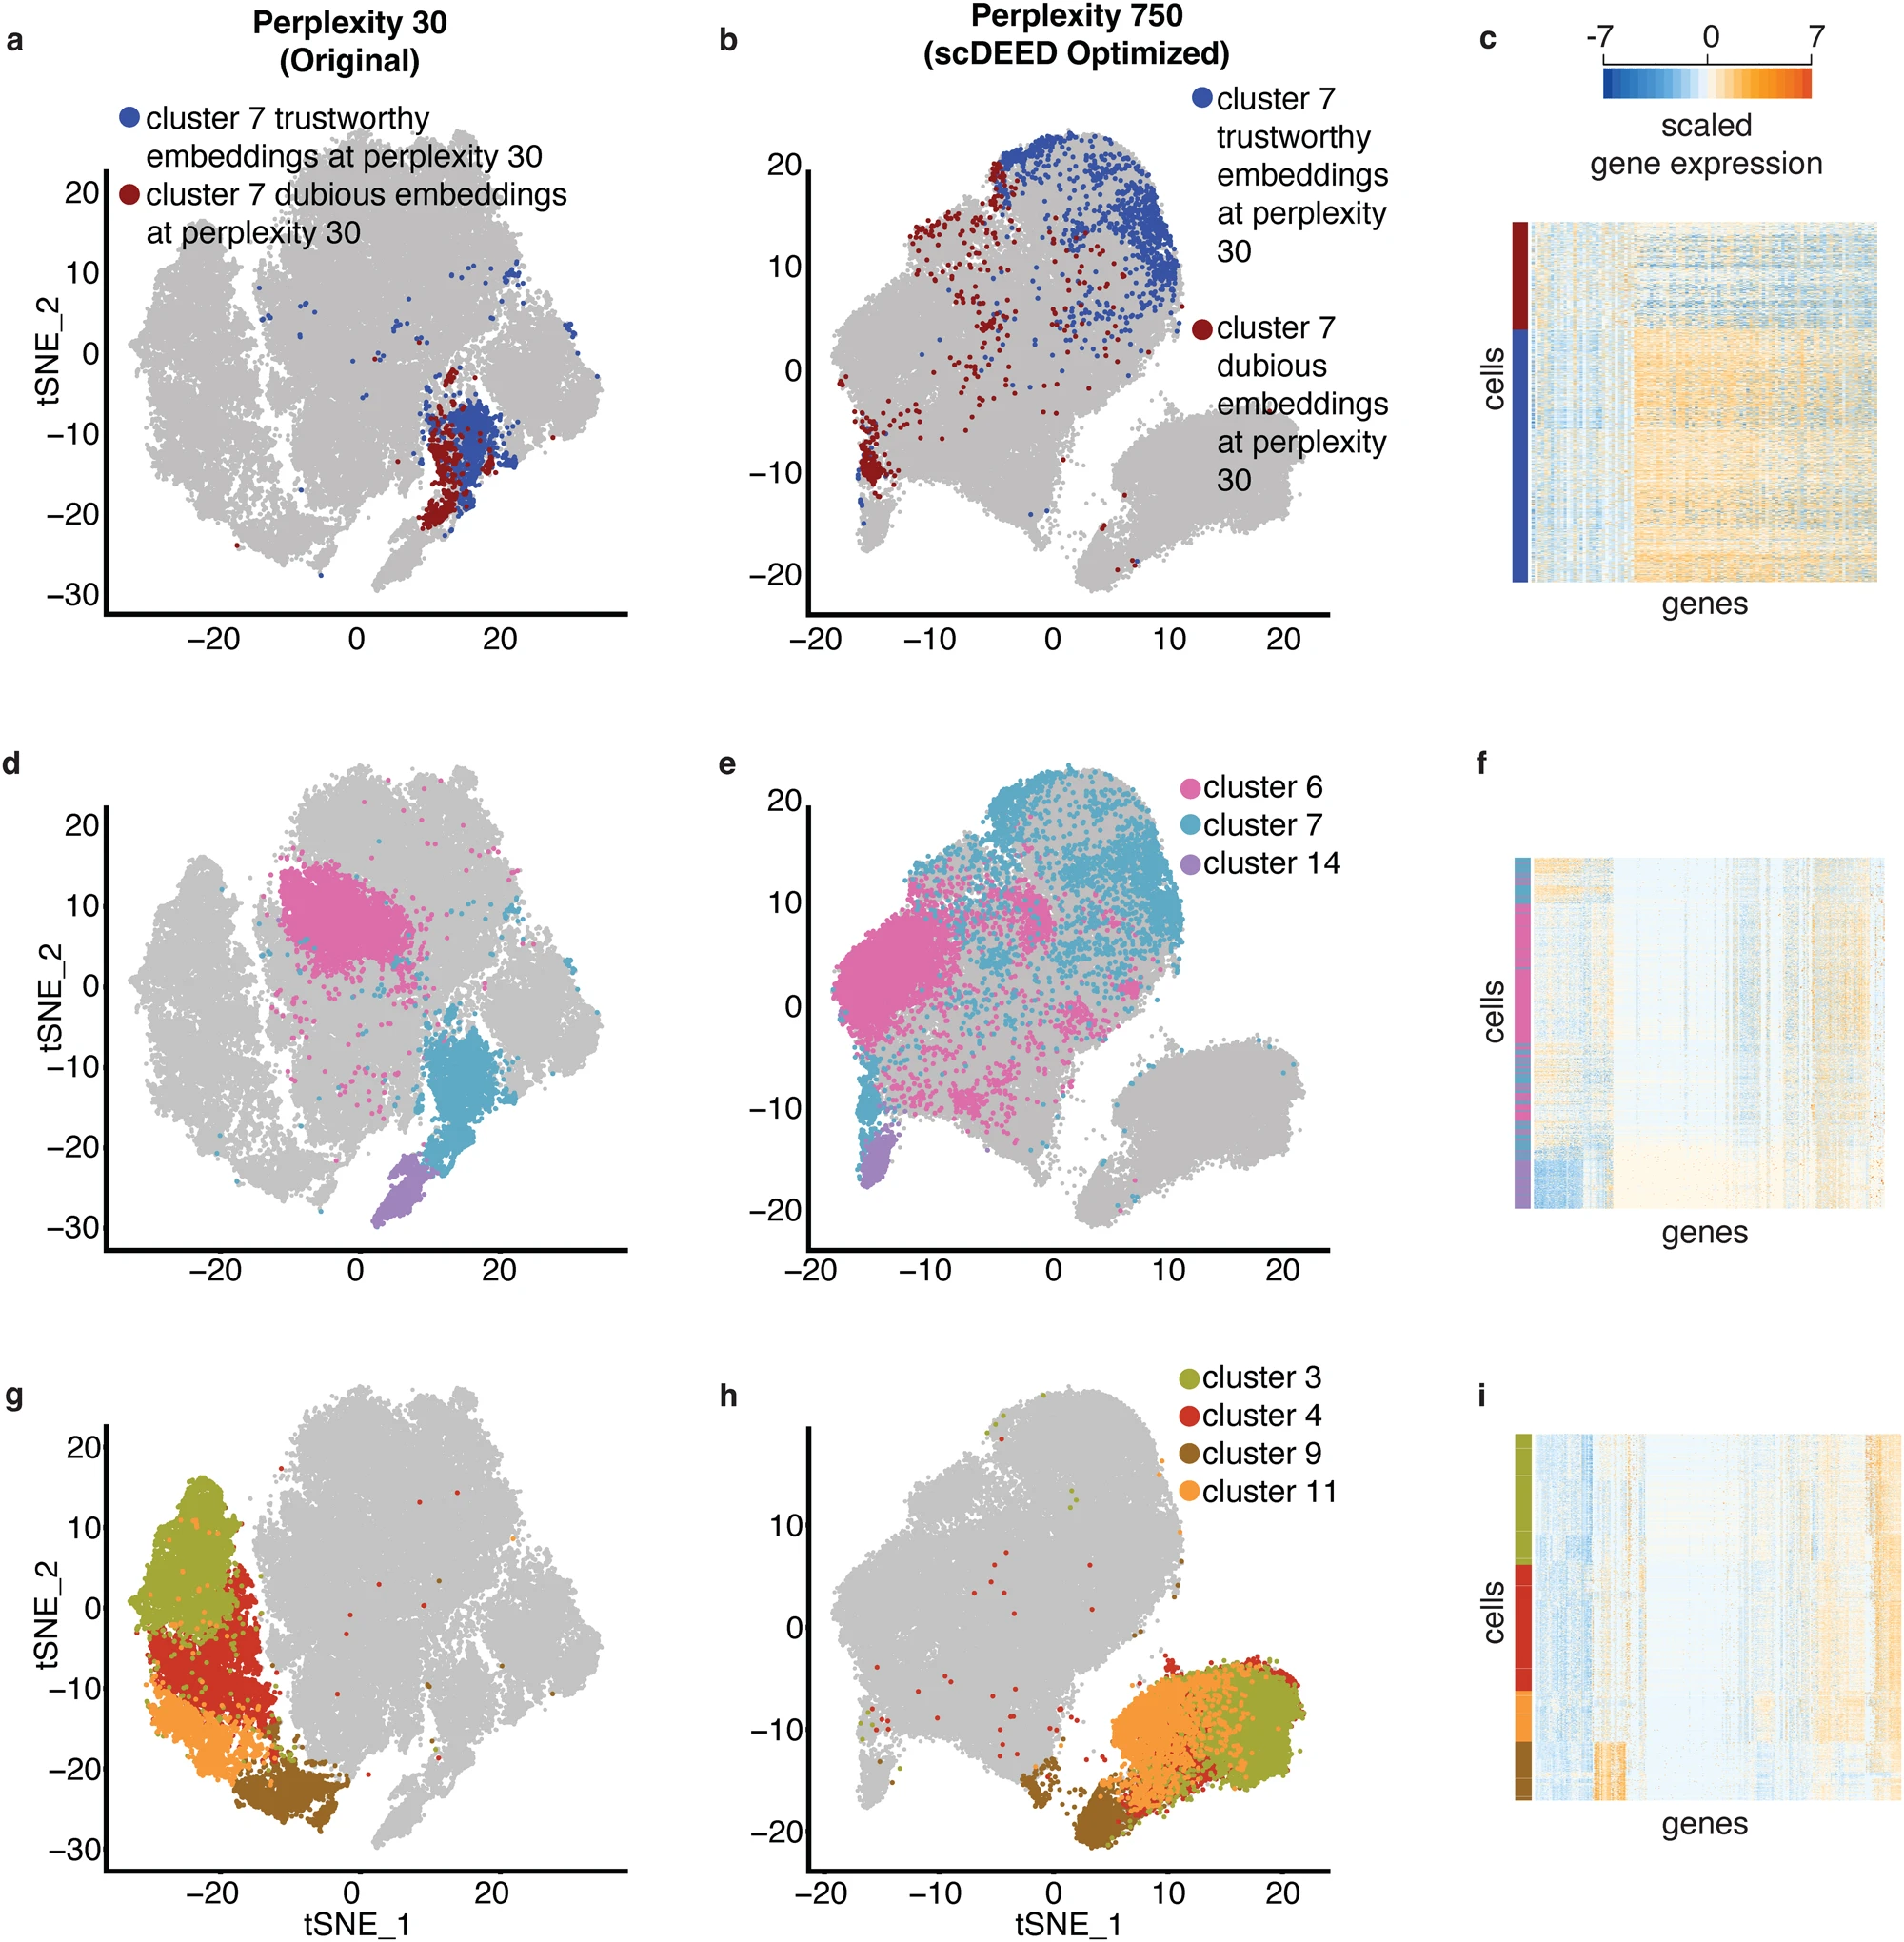
Comparative t-SNE plots of cluster 7’s dubious and trustworthy cell embeddings at the original perplexity 30 (a) and the perplexity 750 optimized by scDEED (b). c Gene expression heatmap of highlighted cells in (a) and (b). Comparative t-SNE plots of clusters 6, 7, and 14 at the perplexity 30 in the original study (d) and the perplexity 750 optimized by scDEED (e). We have recolored cluster 7 for better visualization in (d–f). f Gene expression heatmap of the highlighted cells in (d) and (e), where cells are ordered by the default hierarchical clustering found by the R function heatmap.2(). Comparative t-SNE plots of clusters 3, 4, 9, and 11 at the perplexity 30 in the original study (g) and the perplexity 750 optimized by scDEED (h). We have recolored the clusters for better visualization in (g–i). i Gene expression heatmap of the highlighted cells in (g) and (h).
