
Fig. 9: Evaluation of cluster locations at the original UMAP hyperparameters and the hyperparameters optimized by scDEED on the Samusik dataset.
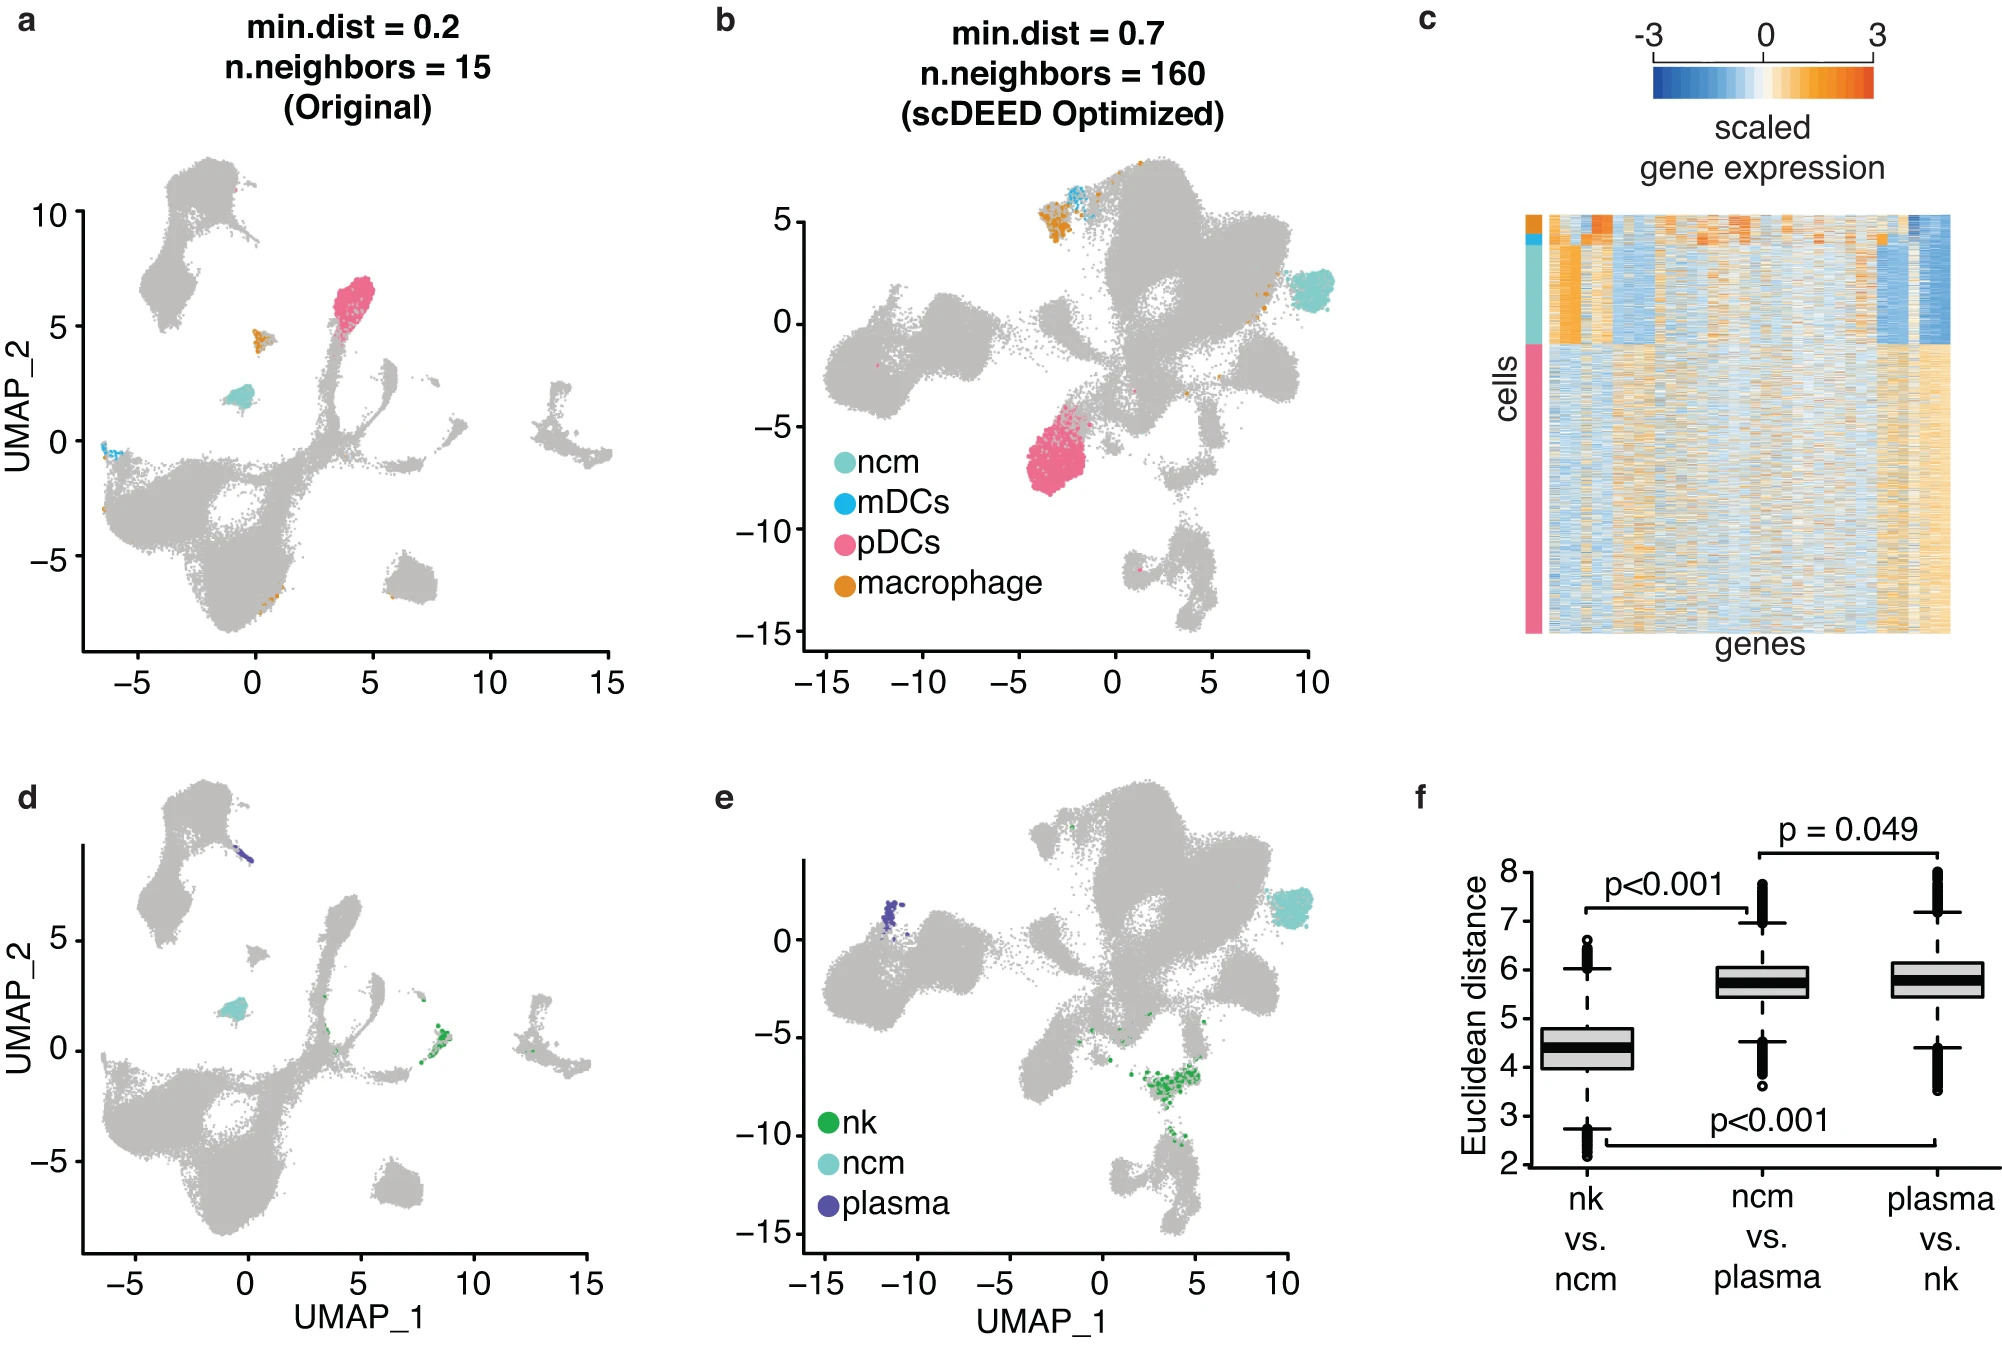
Comparative UMAP plots of the Samusik dataset with the non-classical monocytes (ncm), mDCs, pDCs, and macrophages highlighted at the original hyperparameters of min.dist = 0.2 and n.neighbors = 15 (a) and the hyperparameters of min.dist = 0.7 and n.neighbors = 160 jointly optimized by scDEED (b). c Gene expression heatmap of the highlighted cells in (a) and (b). Comparative UMAP plots of the Samusik dataset with the NK cells (nk), ncm, and plasma cells highlighted at the original hyperparameters (d) and the hyperparameters optimized by scDEED (e). f Comparison of distances between ncm, nk, and plasma cells. The box center lines, bounds, and whiskers denote the medians, first and third quartiles, and minimum and maximum values within 1.5 × the interquartile range of the box limits, respectively. The two-sample t statistic p-values for between-boxplot comparisons are presented, with the null distribution computed based on 1000 random partitions of the cells in the three types by preserving the three cell type sizes (the theoretical t distribution should not be used because the distances are not independent). The two-sample t statistics are as follows: (nk vs. ncm, n = 192,024 pairs) vs (ncm vs. plasma, n = 119,888 pairs) = −728.580 (p < 0.001), (nk vs. ncm, n = 192,024 pairs) vs (plasma vs. nk, n = 22,302 pairs) = −370.042 (p < 0.001), (ncm vs. plasma, n = 119,888 pairs) vs (plasma vs. nk, n = 22,302 pairs) = −13.094 (p = 0.049). f confirms that (e) better preserves the three clusters’ relative distances than (d) does. Source data are provided as a Source Data file uploaded on Zenodo.
