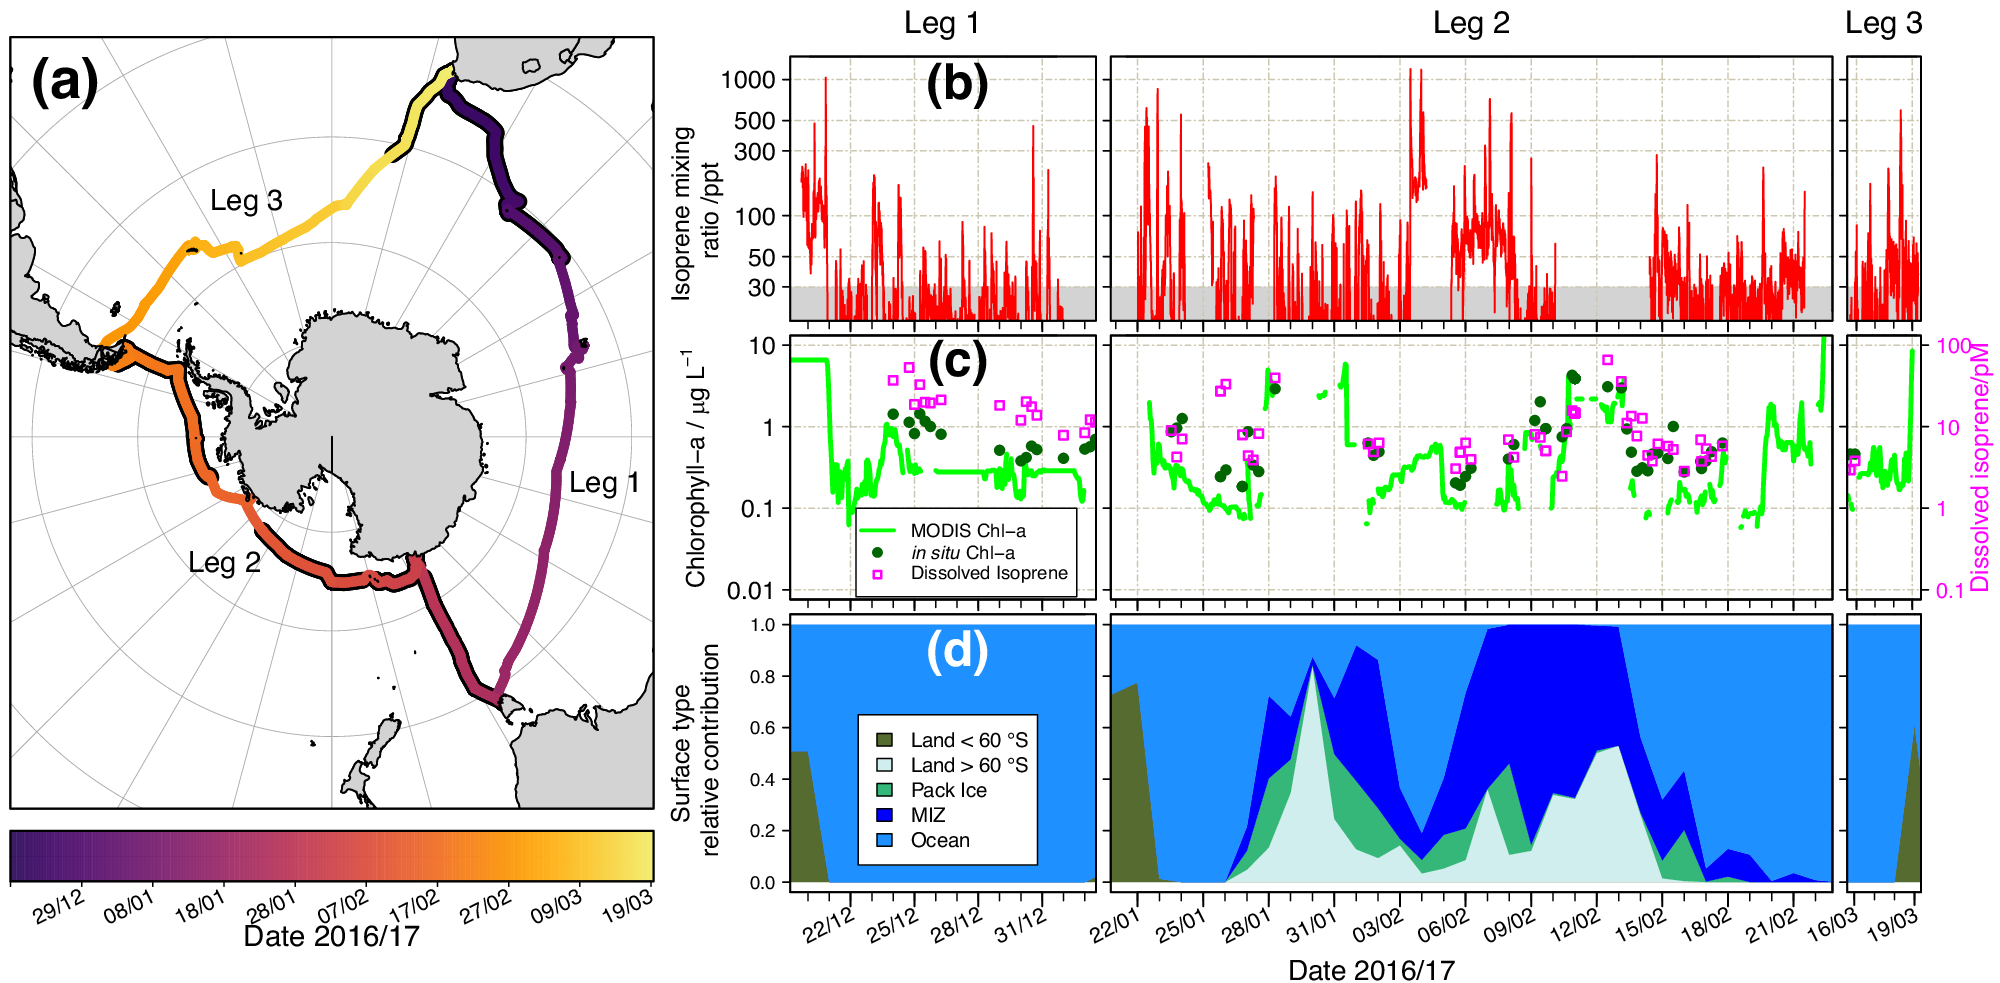
Fig. 1: Summary of isoprene measurements and related variables during the Antarctic Circumnavigation Expedition (ACE).
From: Atmospheric isoprene measurements reveal larger-than-expected Southern Ocean emissions

a Ship track for the ACE campaign. Sections of the track with a black border indicate where measurements of atmospheric isoprene are available; (b–d) Time series for: observed atmospheric isoprene mixing ratios (b, note the log scale), with the grey area indicating data below instrument LOD (30 ppt); in situ chlorophyll-a and dissolved isoprene along with chlorophyll-a from MODIS-Aqua (c); daily mean relative contribution of surface types along the air mass back trajectories (d).
