
Fig. 1: Overview of the pan-cancer tumor-normal landscape at single-cell resolution.
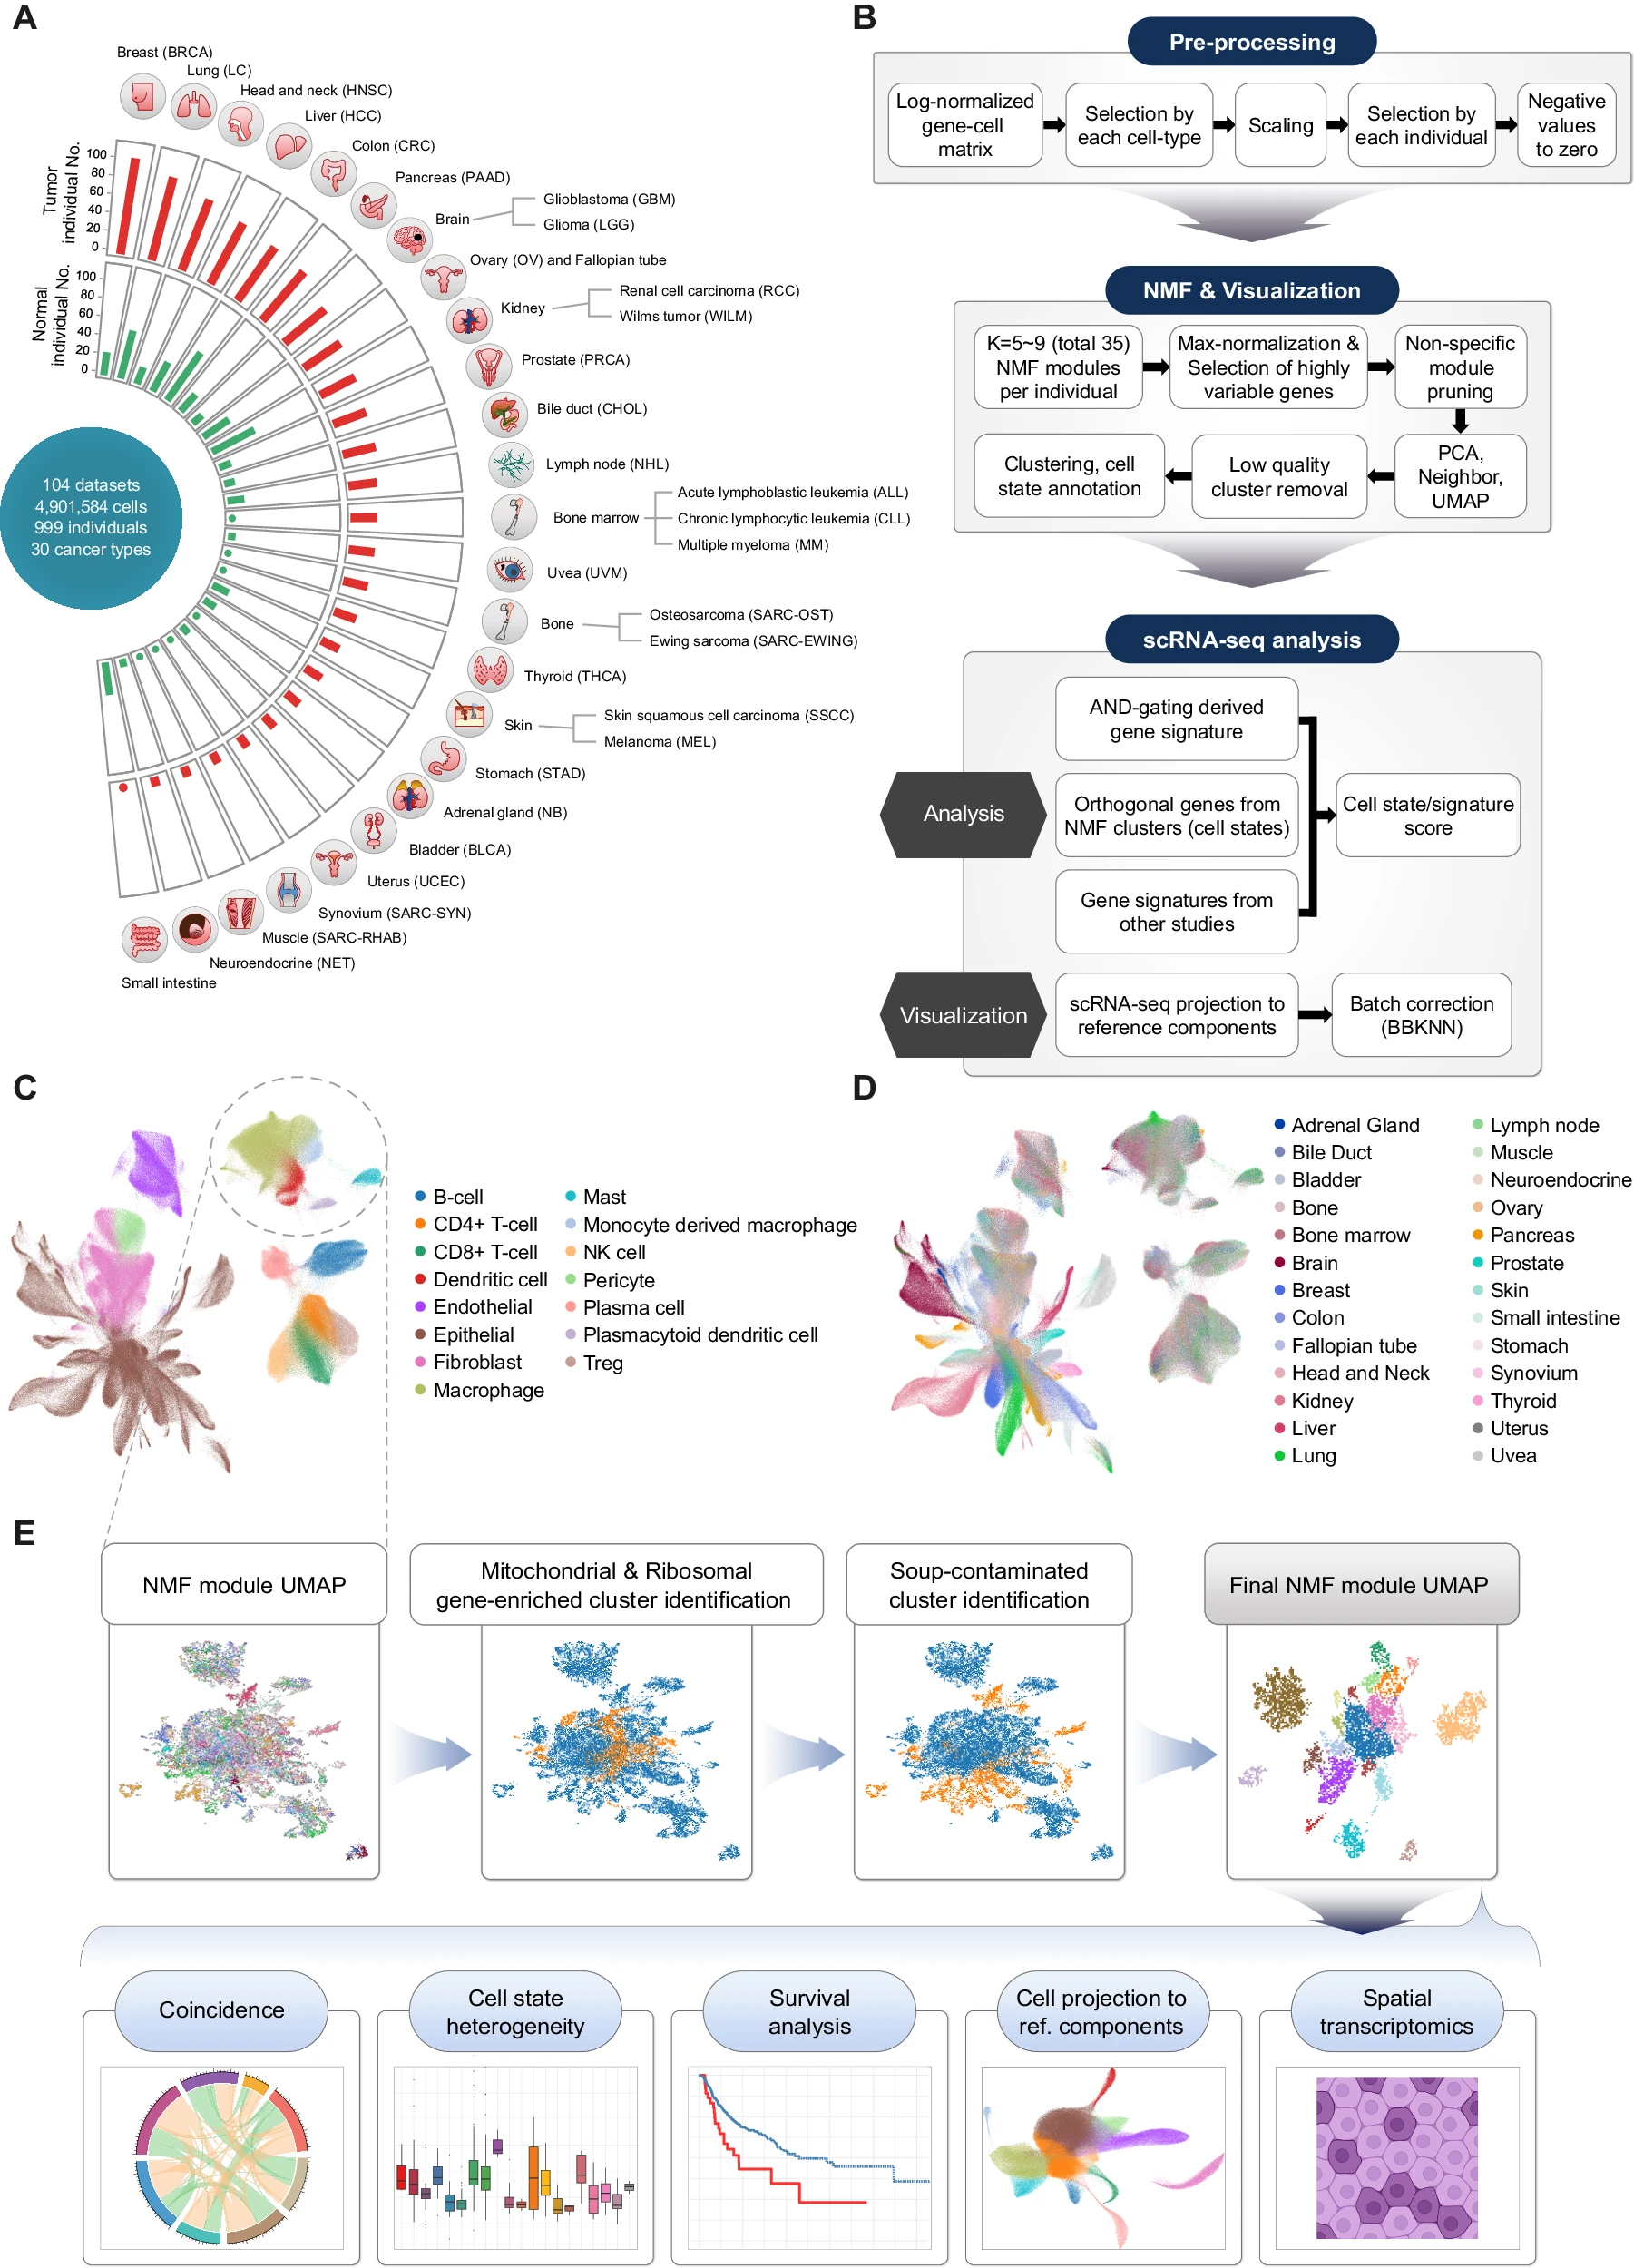
A Overview of the scRNA-seq cohort across the 30 cancer types collected in this study. B Workflow of the tumor-normal single-cell transcriptomic atlas and NMF processing. UMAP visualization of a subset of the tumor-normal single-cell atlas colored by (C) cell types and (D) organ origins. E Graphical clustering schematics of NMF modules with automatized soup-effect detection algorithm and subsequent analyses.
