
Fig. 2: Landscape of hallmark genes of tissue ecosystems across organs.
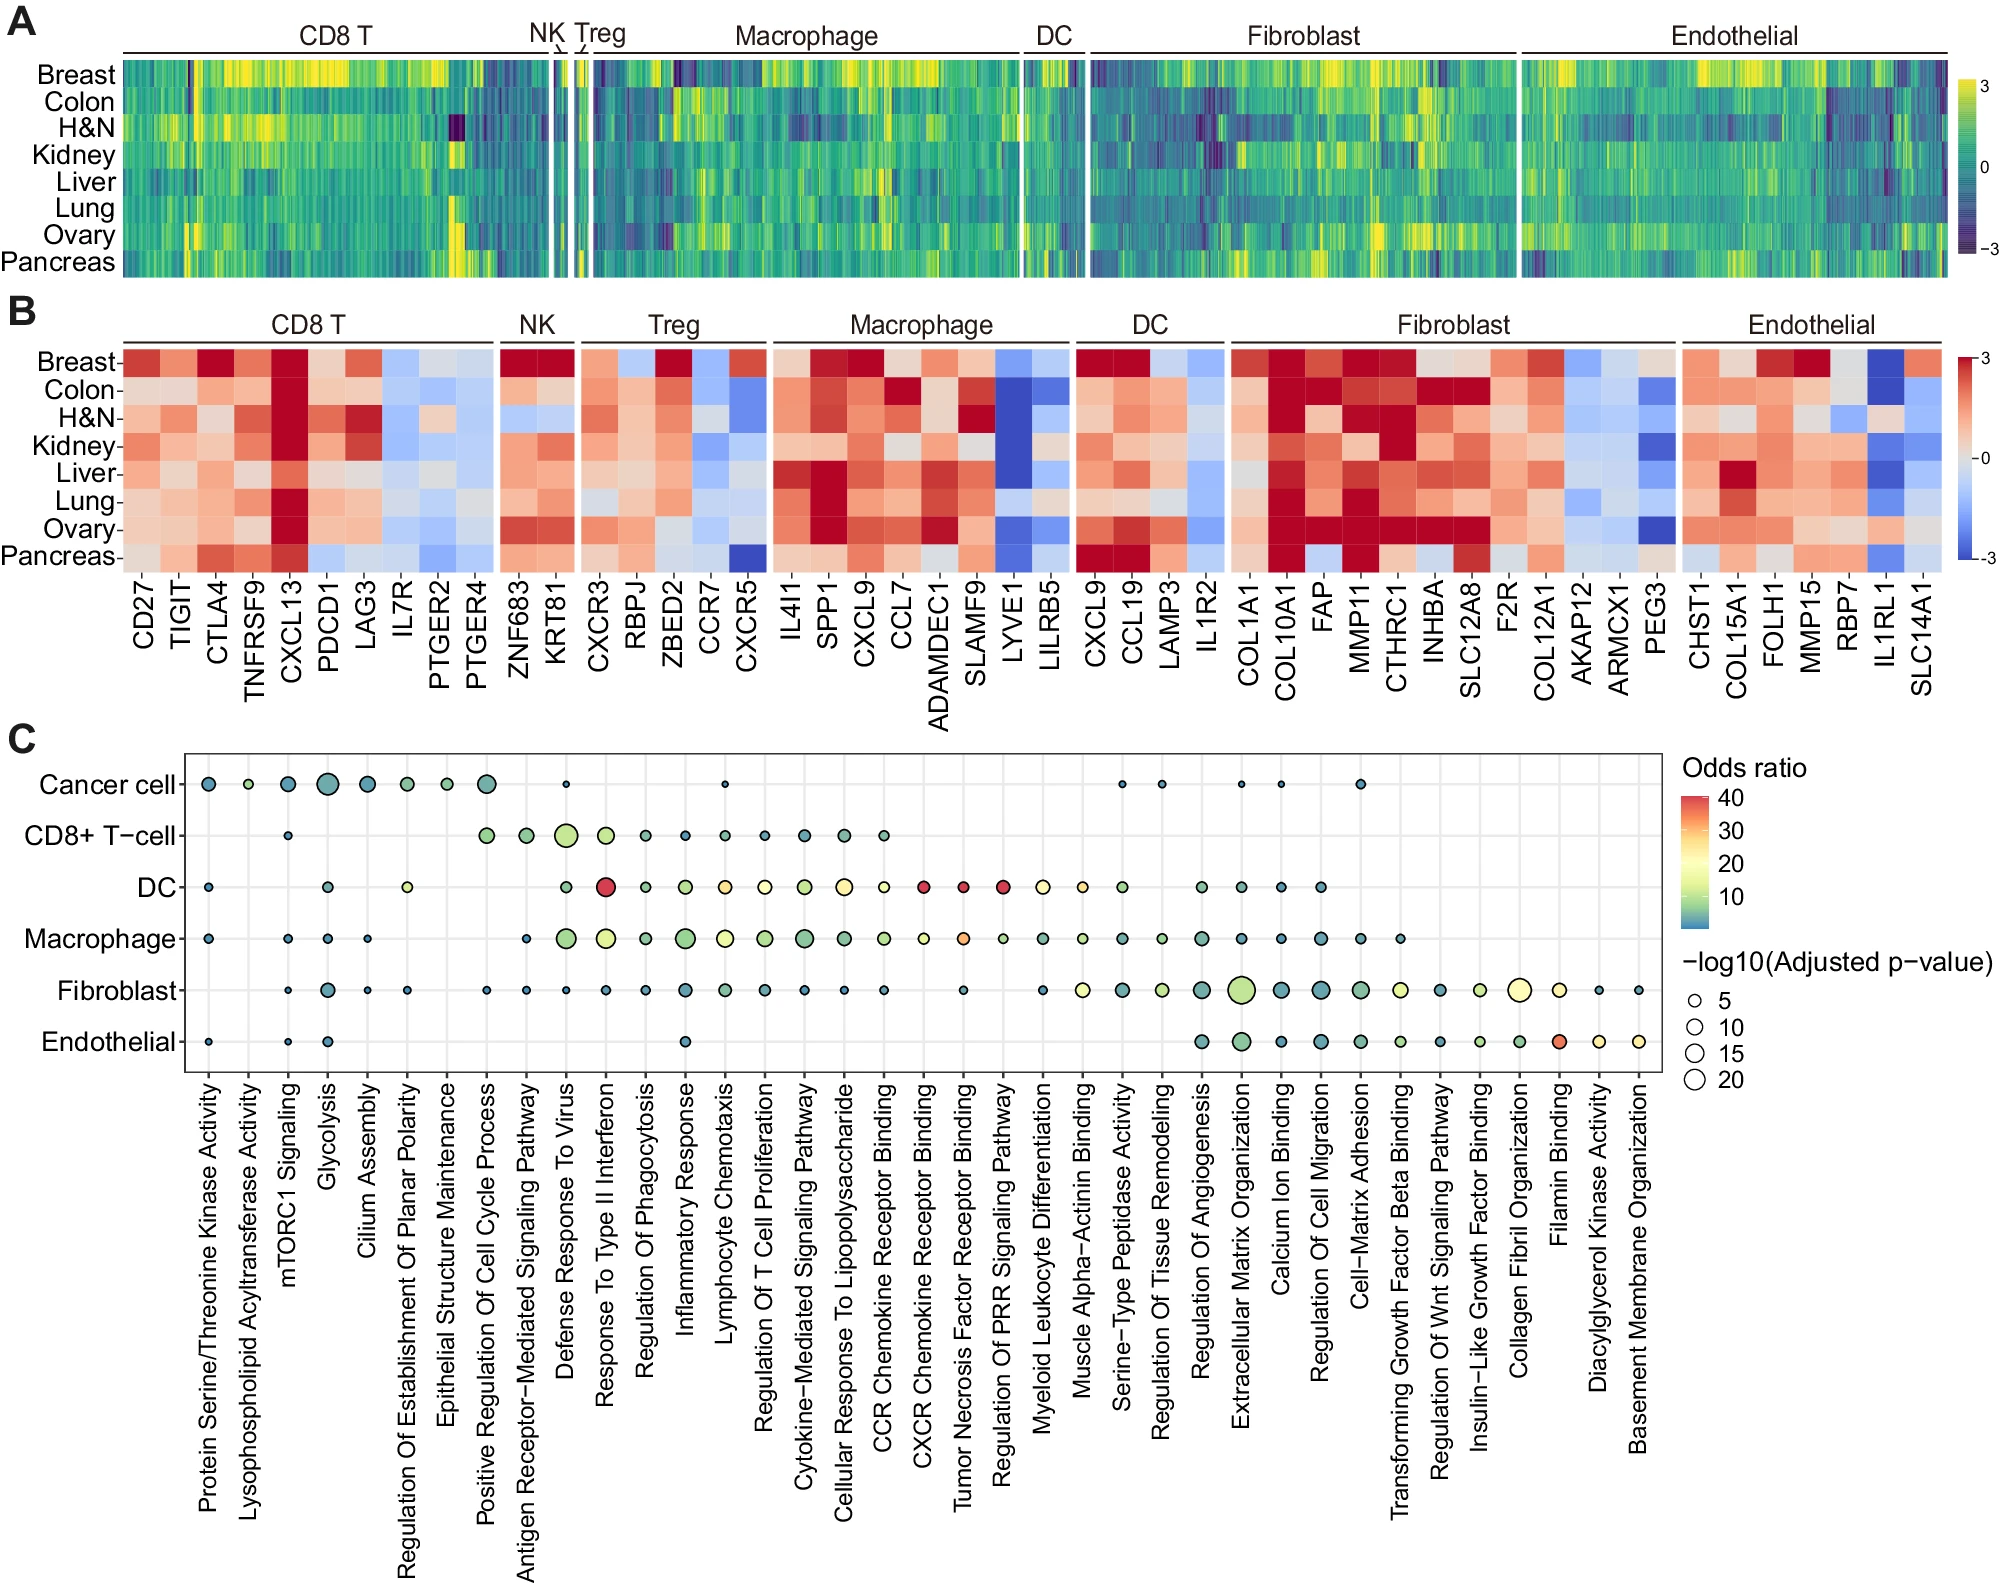
A Characterization of hallmark genes in tumor and normal ecosystems across organs. Cell type is noted on top of the heatmap and only the genes that are upregulated in four or more cancer types are depicted. Each box in the heatmap represents log2 fold-change values with positive values indicating upregulation in tumors. H&N, head and neck; DC, dendritic cell; NK, natural killer cell; Treg, regulatory T cell. B Detailed heatmap of hallmark genes identified in Fig. 2A across cancer and cell types. Each color in the heatmap represents log2 fold-change values with positive values indicating upregulation in tumors. H&N, head and neck; DC, dendritic cell; NK, natural killer cell; Treg, regulatory T cell. C Gene ontology analysis of tumor hallmark genes of diverse cell types using Enrichr. The color and size of the dot represent the odds ratio and p value from two-sided Fisher’s exact test, adjusted with the Benjamini-Hochberg method, respectively. PRR, pattern recognition receptor.
