
Fig. 5: Tumor-specific occurrence of interferon-enriched and pro-tumorigenic community and determination of immunotherapy-predictive cell states.
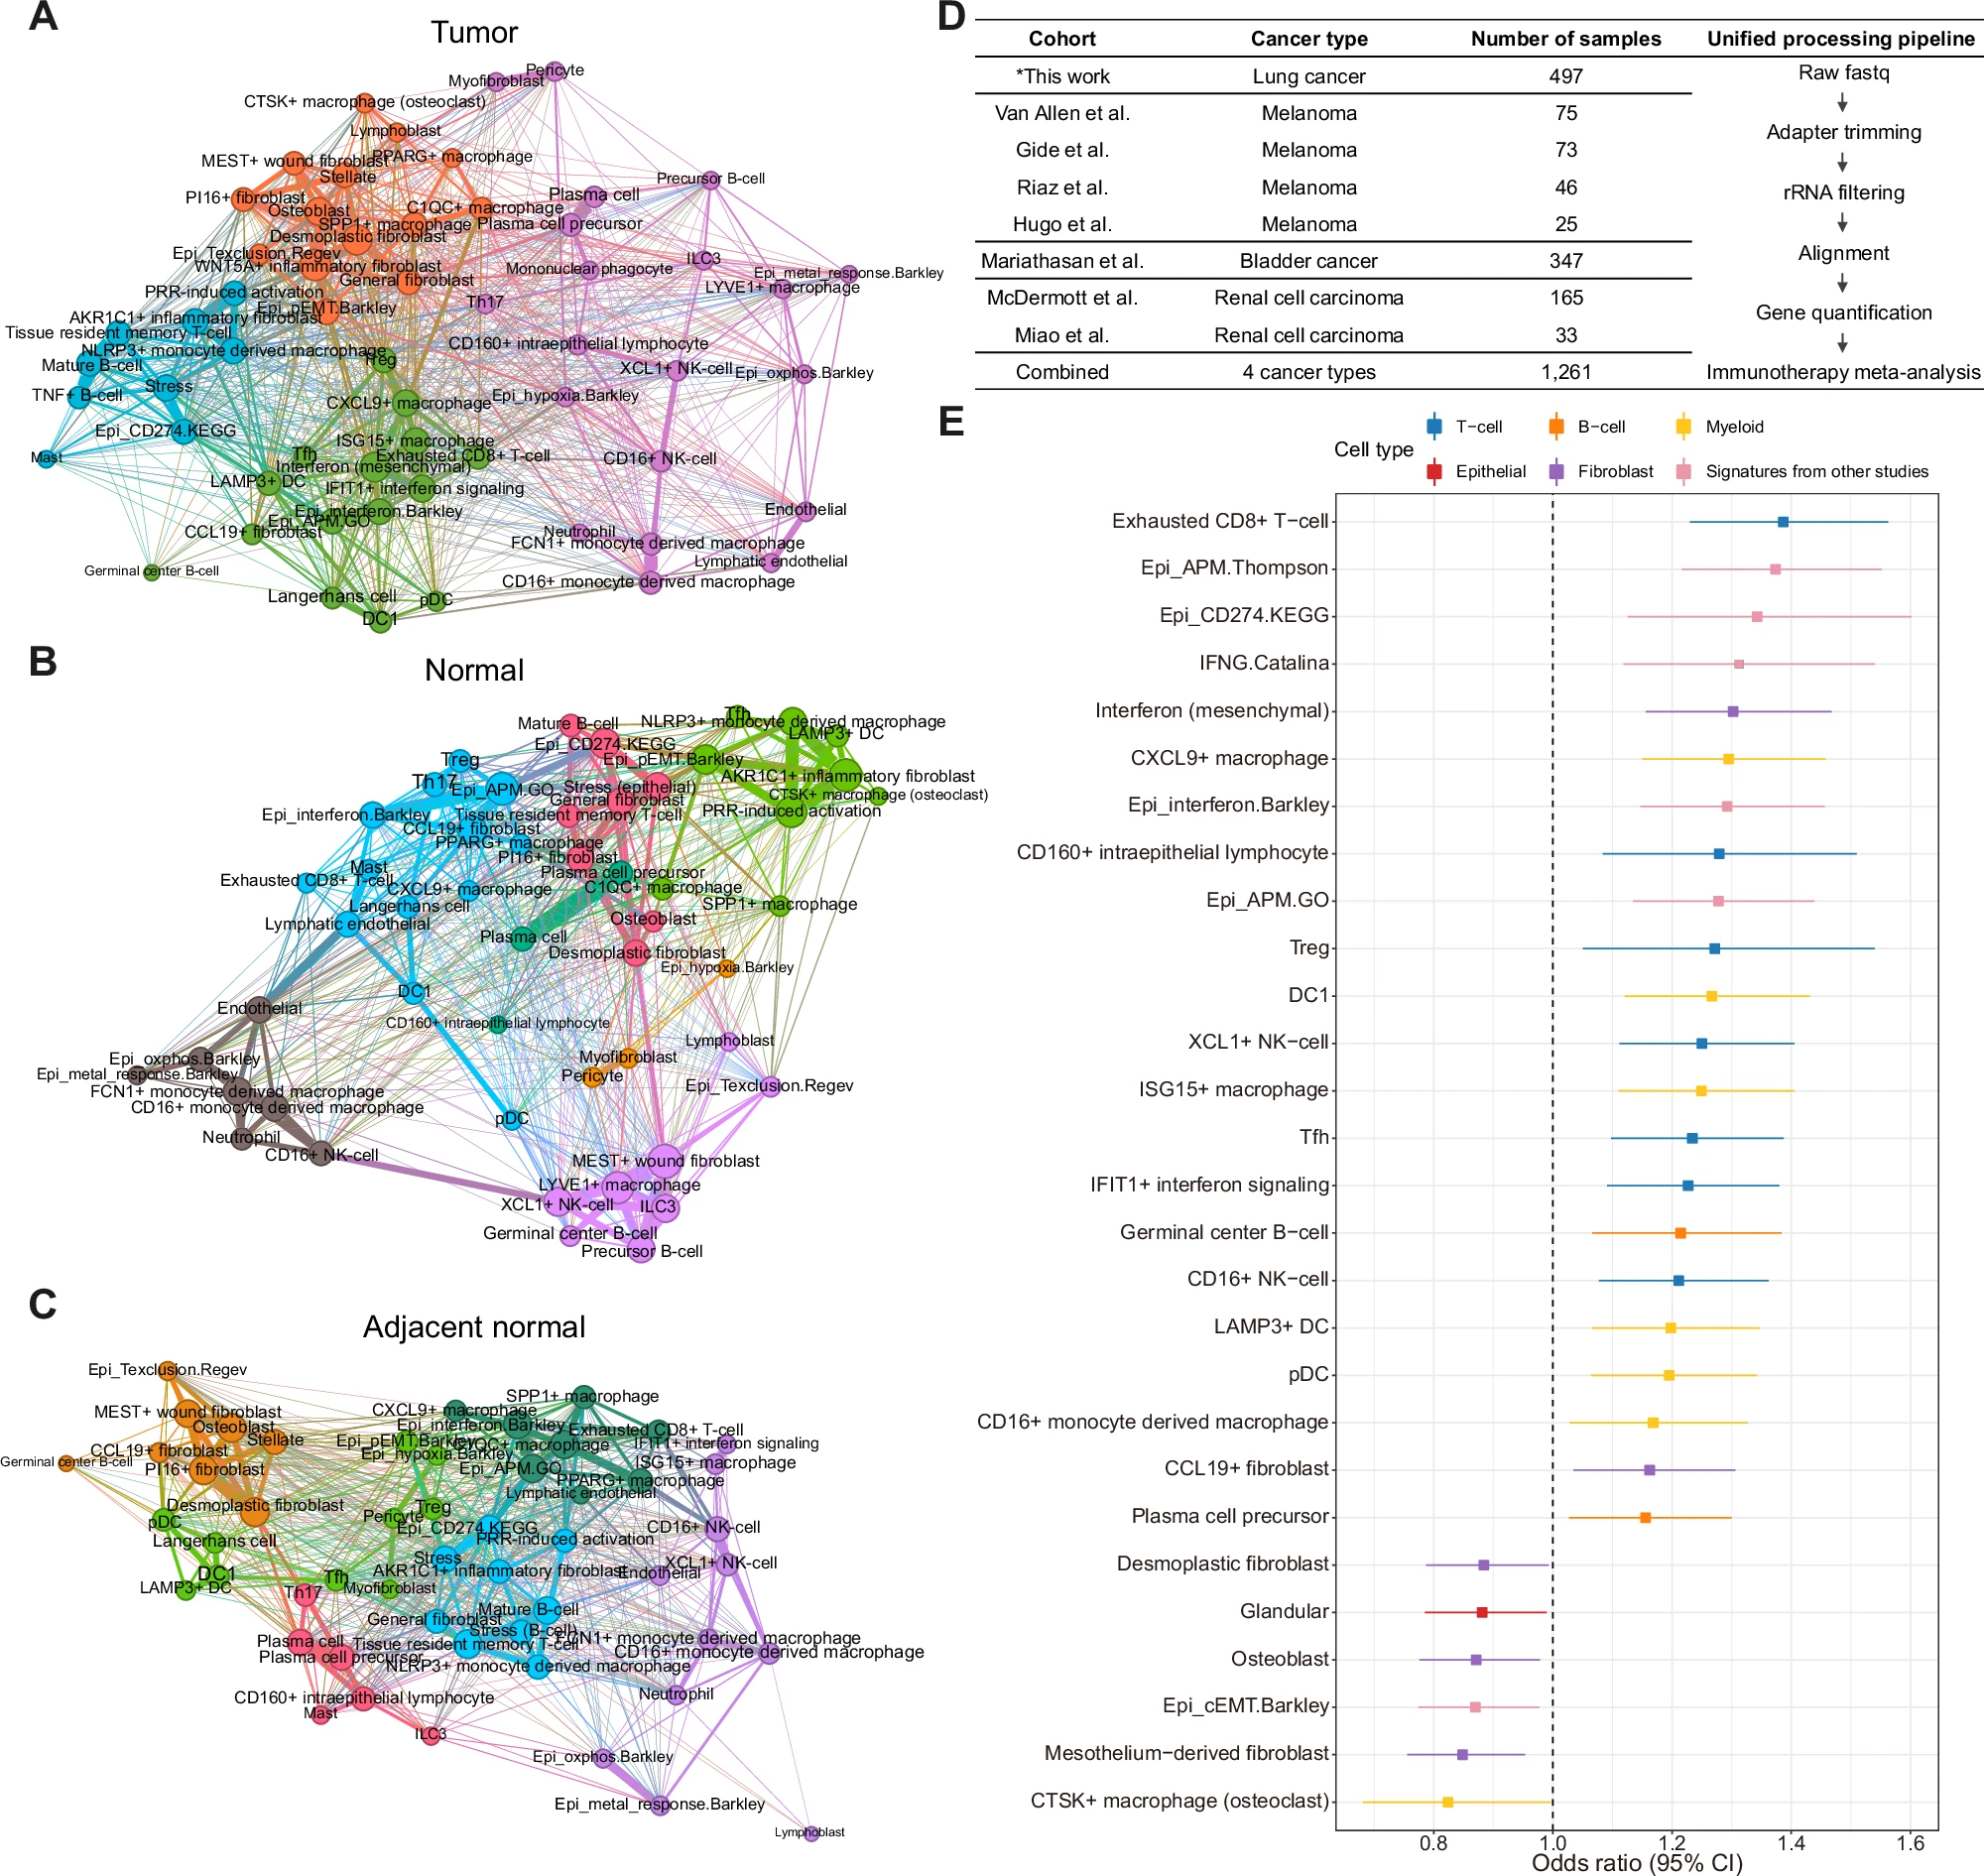
Co-occurrence network in the (A) tumor, (B) normal, and (C) adjacent normal tissues. The color of the nodes and edges corresponds to the modularity community and the thickness of the edges corresponds to the magnitude of adjacency. DC, dendritic cell; EMT, epithelial-to-mesenchymal transition; ILC3, type 3 innate lymphoid cells; NK, natural killer cell; pDC, plasmacytoid dendritic cell; PRR, pattern recognition receptor; Texclusion, T cell exclusion program; Tfh, T follicular helper cells; Th17, T helper type 17; Treg, regulatory T cell. D Summary of the immunotherapy-treated bulk RNA-seq cohorts with response data used in this study. * indicates newly generated data. E Forest plot of immunotherapy-response predictive cell states and gene signatures from other studies through meta-analysis of immunotherapy-treated bulk RNA-seq cohorts (n = 1261 patients). The x-axis represents the odds ratio, in which the dotted vertical line represents an odds ratio of 1, and the y-axis denotes cell states and previously defined gene signatures. For each cell state, rectangles and extended lines represent odds ratios and 95% confidence intervals, respectively, calculated through meta-analysis from logistic regression for clinical response across immunotherapy-treated cohorts. Only cell states that achieved statistical significance are depicted. Cell states with odds ratios greater than 1 are those associated with favorable responses to immunotherapy. The colors correspond to the cell type categories of each cell state. APM, antigen-presenting machinery; DC, dendritic cell; EMT, epithelial-to-mesenchymal transition; IFNG, interferon-gamma; NK, natural killer cell; pDC, plasmacytoid dendritic cell; Treg, regulatory T cell. Source data are provided as a Source Data file.
