
Fig. 2: Module-based profiles can classify inflammatory skin diseases.
From: Immune modules to guide diagnosis and personalized treatment of inflammatory skin diseases
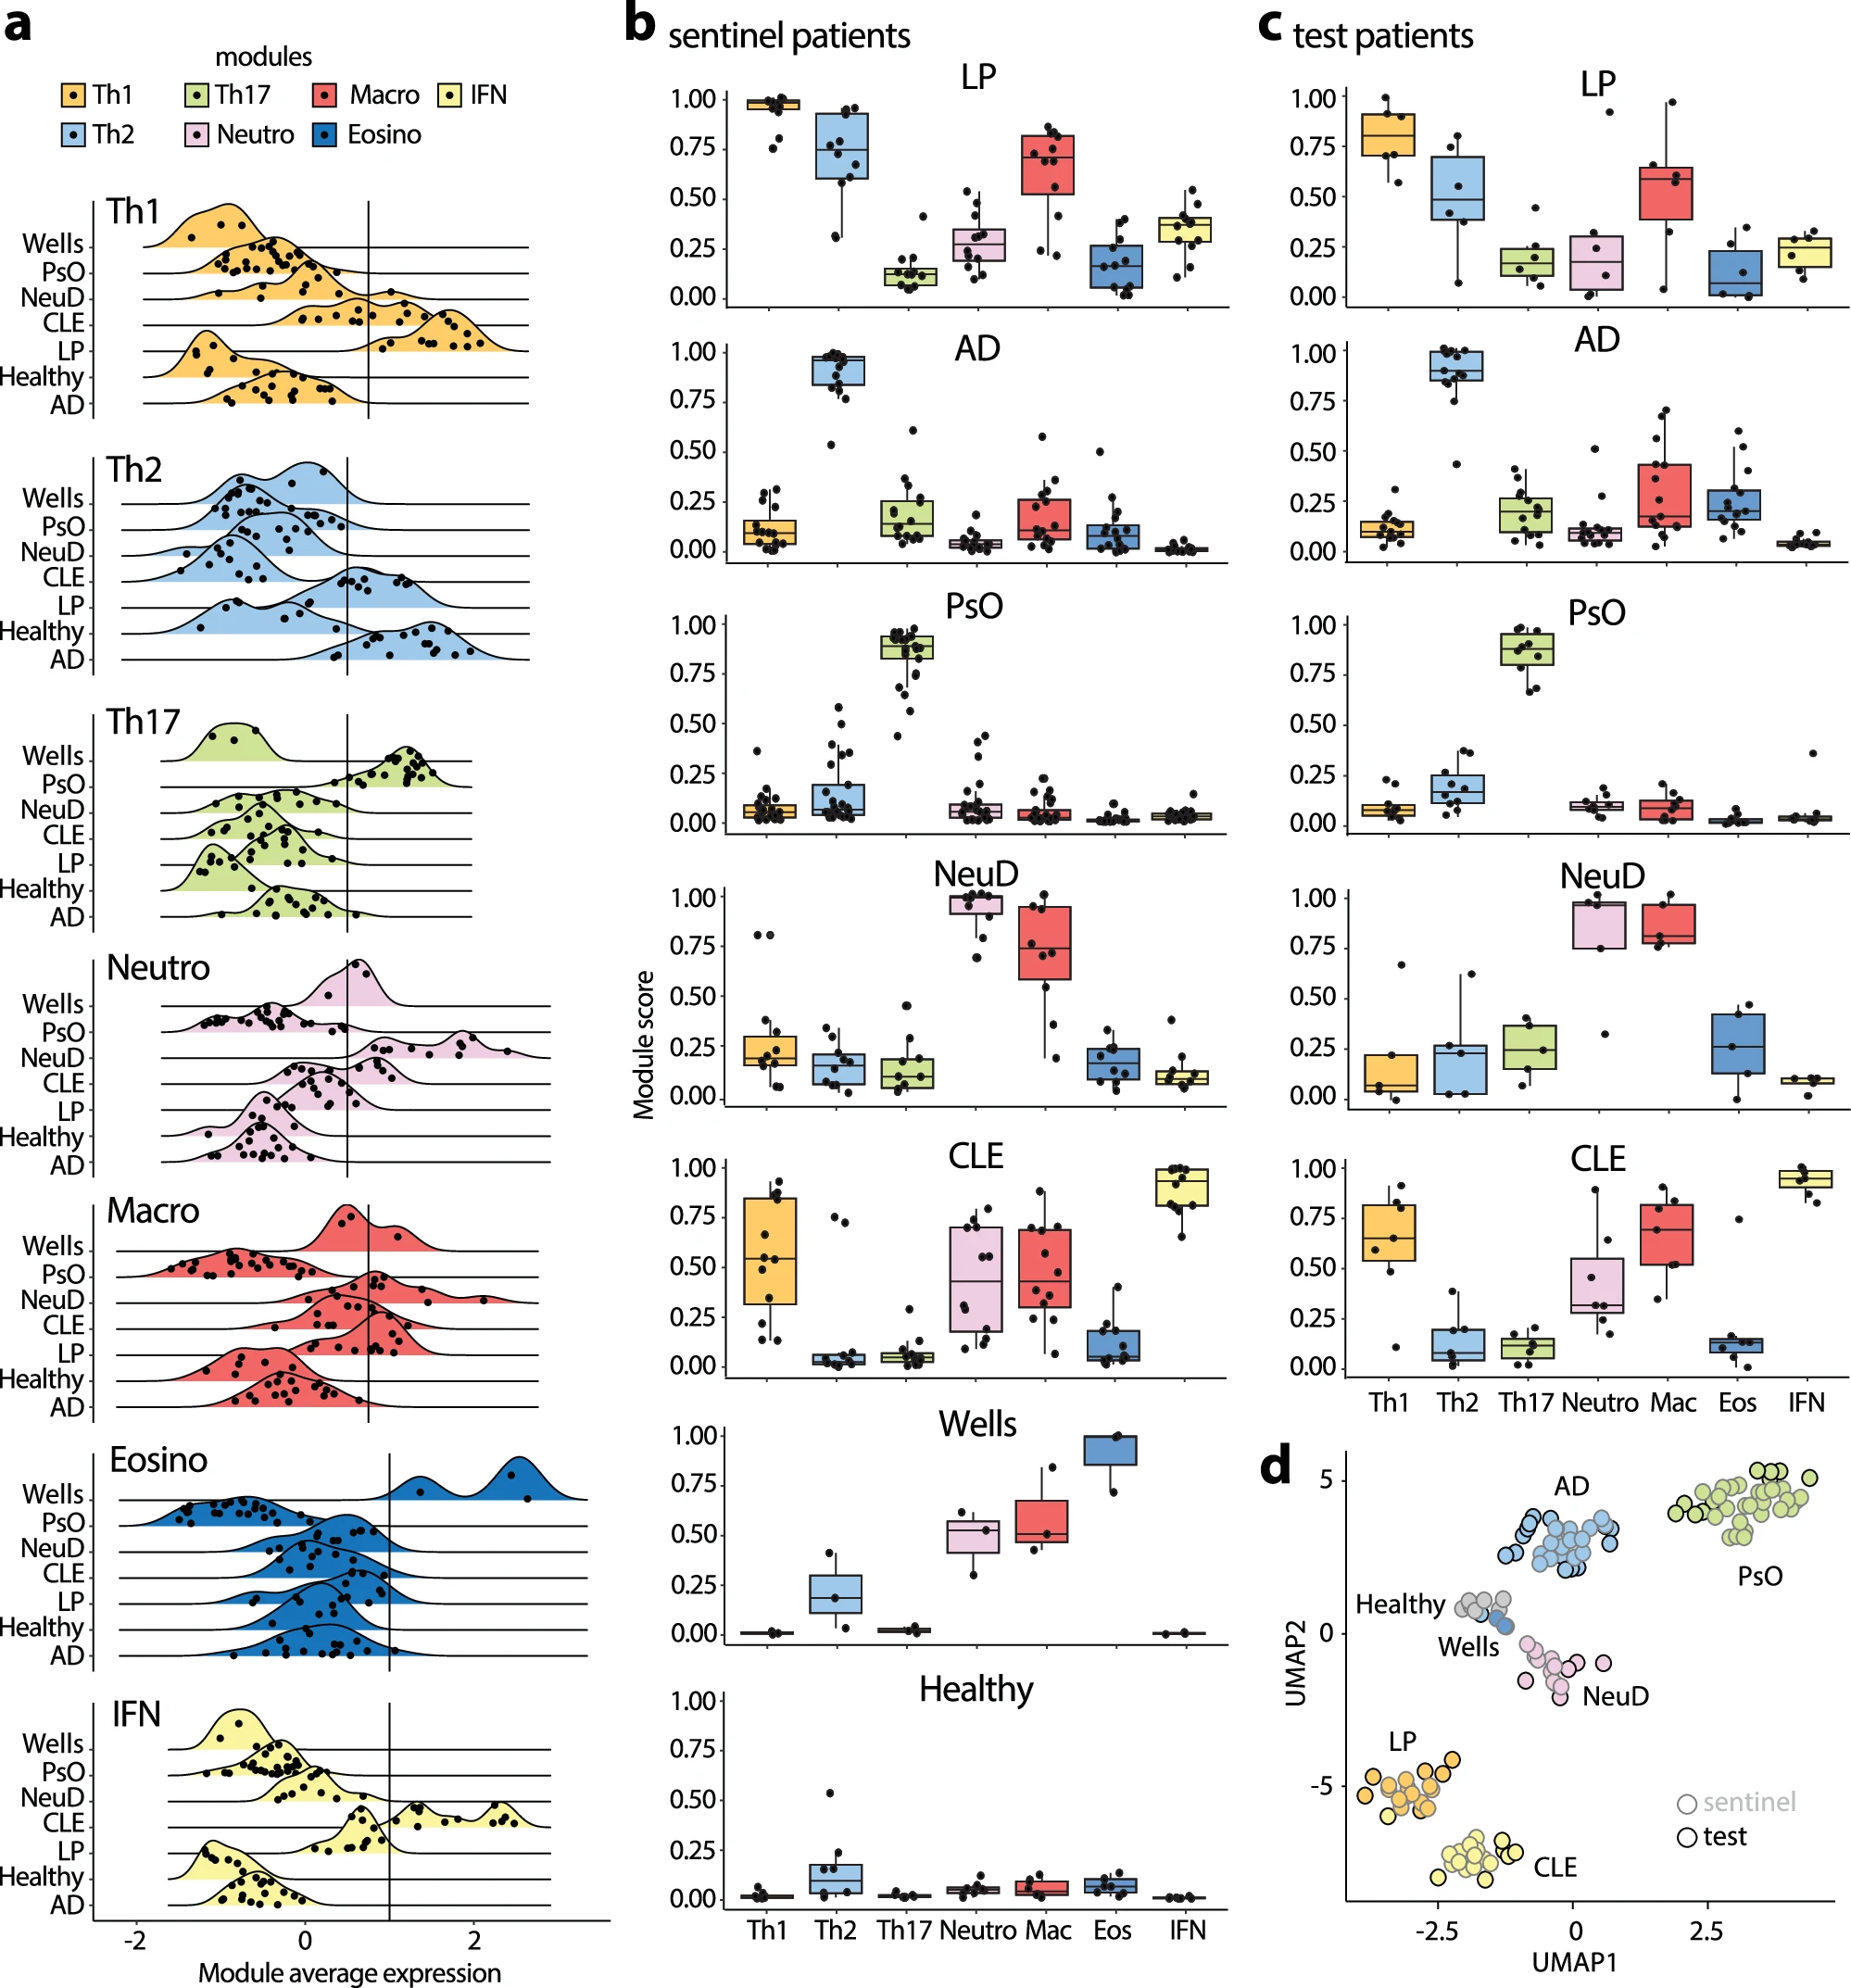
a Ridgeline plots depict Th1, Th2, Th17, type I interferon (IFN), neutrophilic (neutro), macrophagic (macro) and eosinophilic (eosino) module scores in sentinel biopsies across model inflammatory skin diseases (PsO, AD, LP, CLE, NeuD, Wells). Solid lines indicate the thresholds of module activation. b Box plots showing the normalized modules scores in sentinel biopsies across all model diseases. Each dot represents one sentinel biopsy. LP (n = 12), AD (n = 16), PsO (n = 25), NeuD (n = 10), CLE (n = 12), Wells (n = 3), Healthy (n = 8). c Box plots illustrating the normalized modules scores in test biopsies. Each dot represents one test biopsy. LP (n = 6), AD (n = 15), PsO (n = 8), NeuD (n = 5), CLE (n = 7). b–c the central line of the box plot is the median. The box’s edges are the lower (25th percentile) and upper quartiles (75th percentile). Whiskers extend to data points within 1.5 times the interquartile range (IQR). d UMAP projection showing clustering of test biopsies with sentinel biopsies having concordant disease diagnosis. Black and grey rings represent test and sentinel biopsies, respectively.
