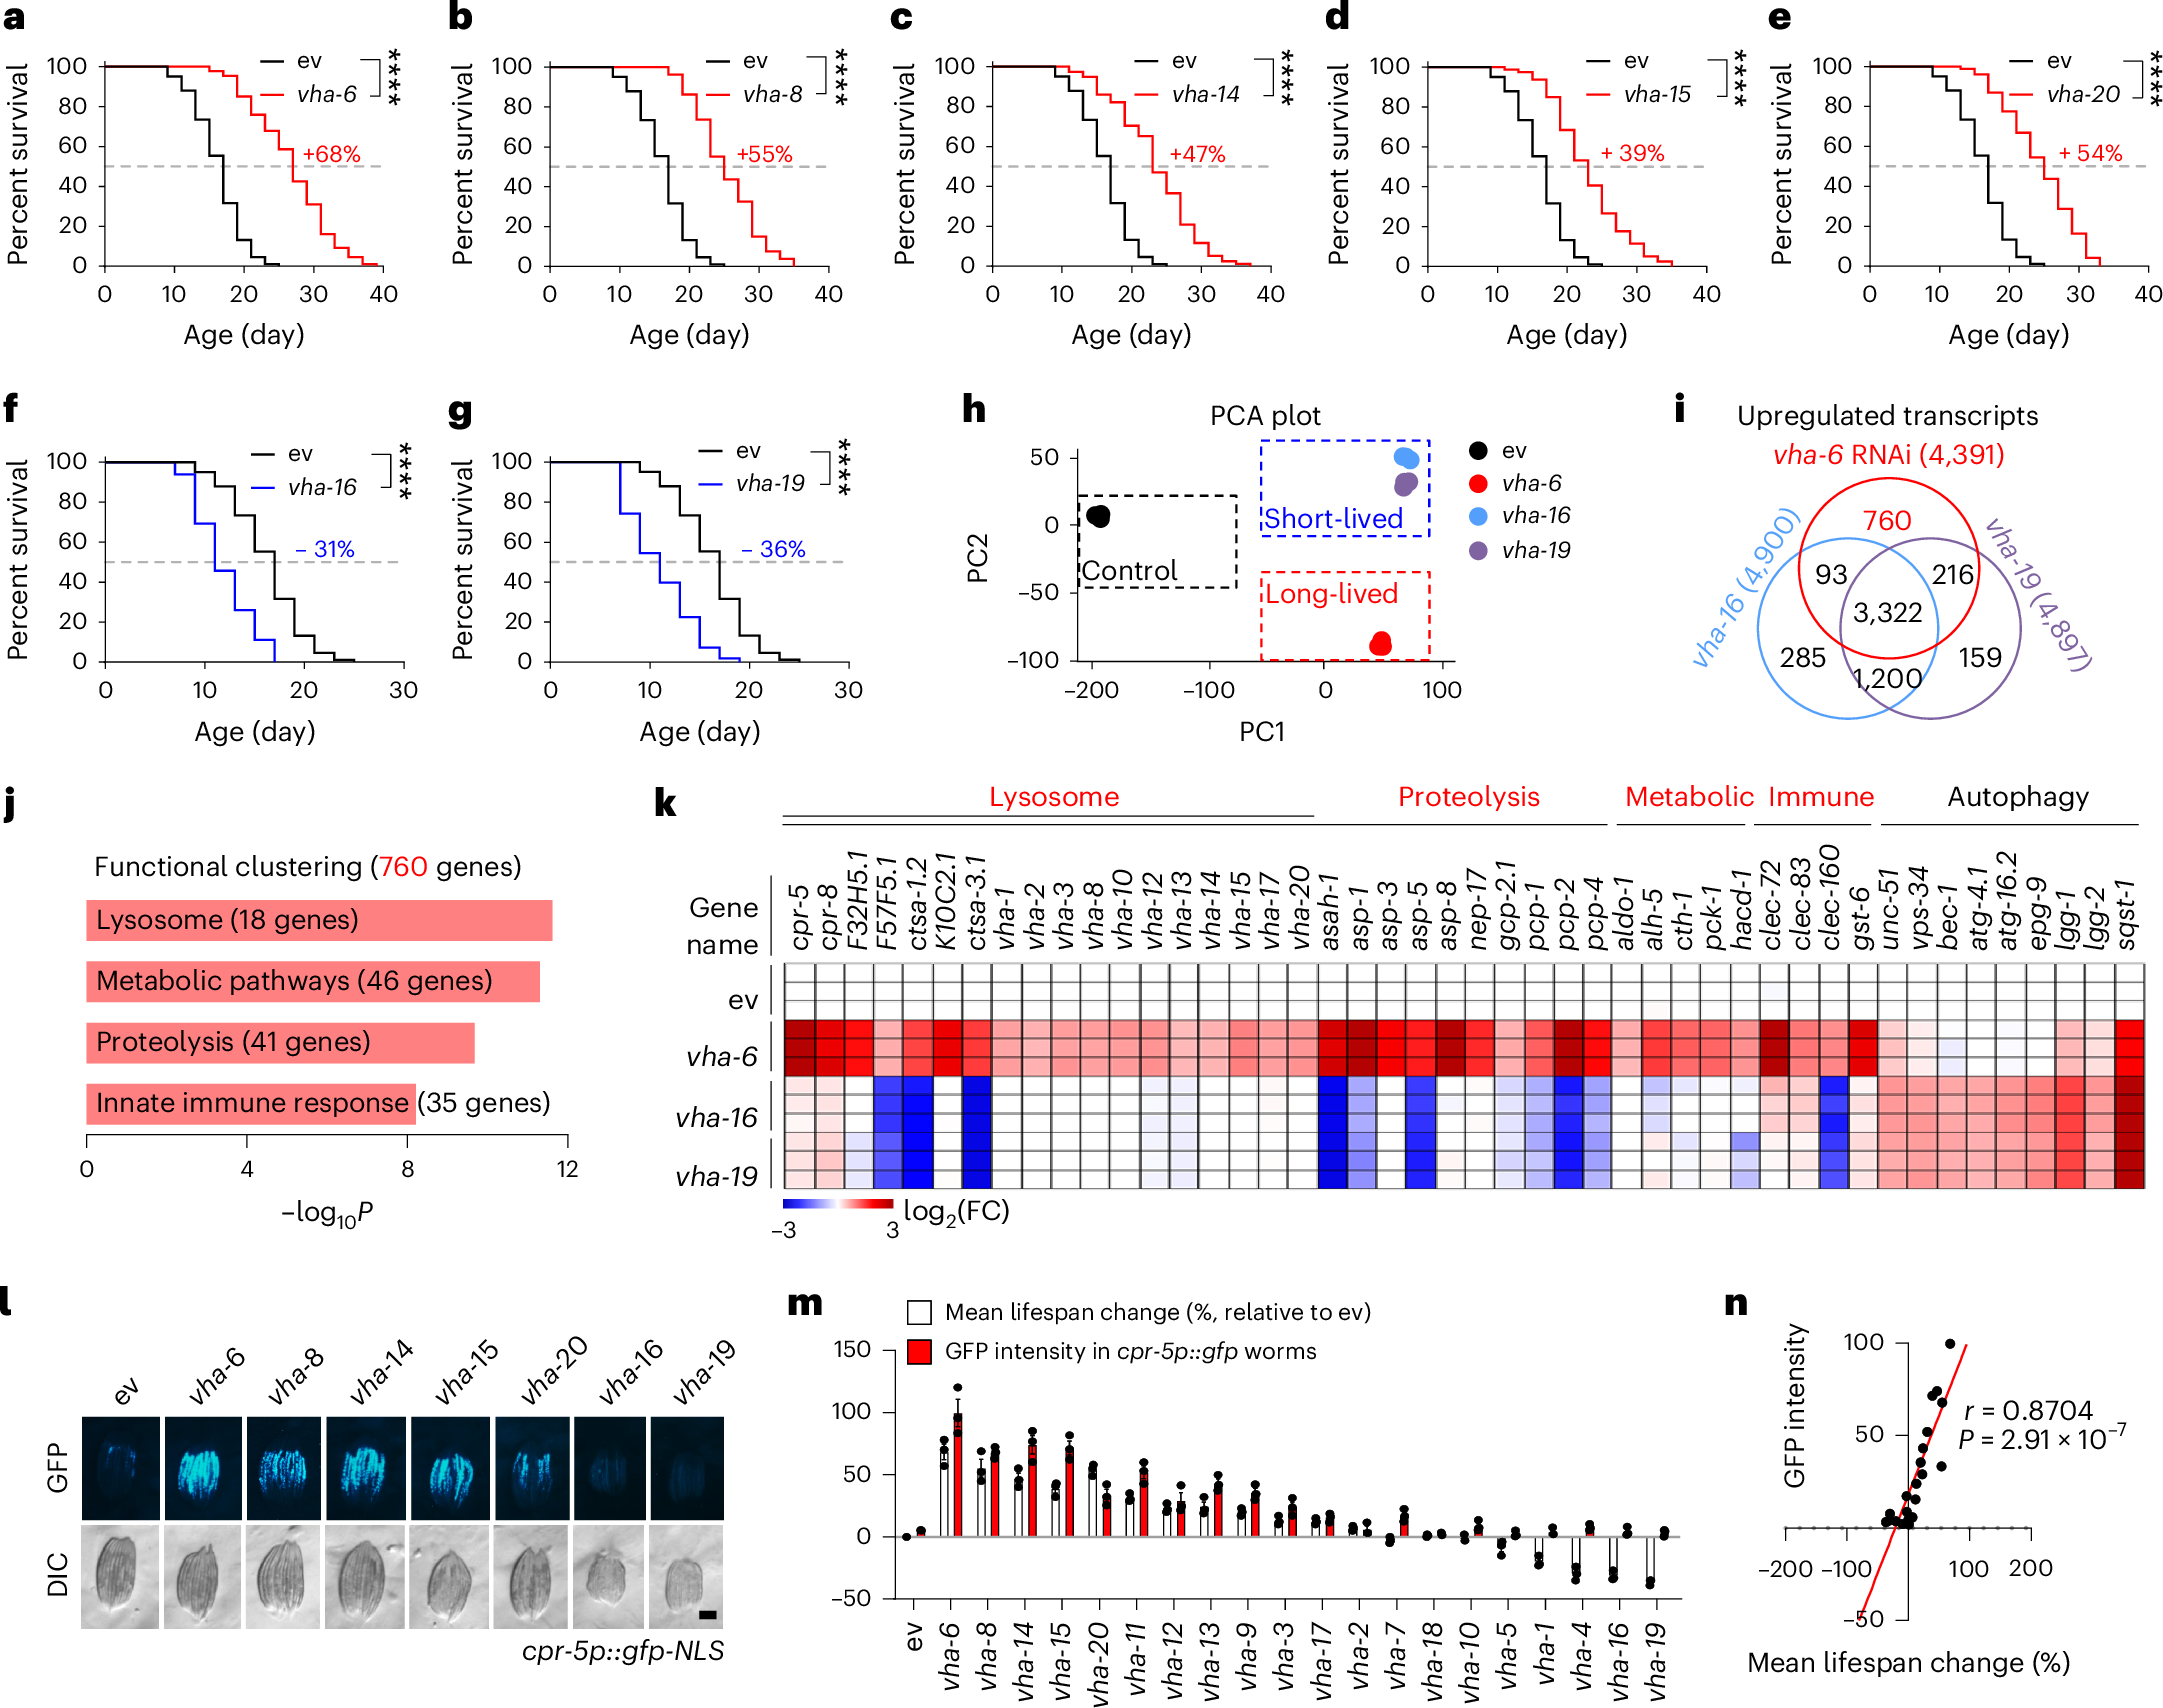
Fig. 1: Knockdown of specific v-ATPase subunits extends C. elegans lifespan and activates an adaptive lysosomal surveillance response.
From: A lysosomal surveillance response to stress extends healthspan

a–g, The survival of worms treated with control (ev) or RNAi targeting vha-6 (a), vha-8 (b), vha-14 (c), vha-15 (d), vha-20 (e), vha-16 (f) and vha-19 (g). Each v-ATPase RNAi occupied 40%, except for vha-6, vha-16 and vha-20 RNAi, which occupied 20% (****P < 0.0001). The control RNAi was used to supply to a final 100% of RNAi for all conditions. The percentages indicate the mean lifespan changes relative to control. h, A principal component analysis (PCA) plot of the RNA-seq results of the worms treated with control, vha-6 (long-lived), vha-16 and vha-19 (short-lived) RNAi. PC, principal component. i, Venn diagram of the upregulated differentially expressed genes (DEGs) in response to vha-6, vha-16 and vha-19 RNAi. j, The functional clustering of the 760 DEGs as indicated in i. The P value was derived from DAVID (a one-sided Fisher’s exact test). k, A heat map of the relative expression levels of representative DEGs in response to vha-6, vha-16 and vha-19 RNAi. The colour represents the gene expression differences in log2FC relative to the control RNAi condition. FC, fold change. l, The GFP expression levels of cpr-5p::gfp worms treated with RNAi targeting different v-ATPase subunits. DIC, differential interference contrast; NLS, nuclear localization signal. Scale bar, 0.3 mm. m, Percentages of the mean lifespan change (relative to the ev condition) and GFP intensity of cpr-5p::gfp worms treated with control or RNAi targeting v-ATPase subunits (n = 3 independent experiments). n, The GFP intensity of cpr-5p::gfp worms positively correlates with worm lifespan change. Pearson’s correlation coefficient (r) was calculated with the mean lifespan change values (x axis) and the GFP intensity of cpr-5p::gfp worms (y axis) as indicated in m (two-sided P value). The error bars denote the standard error of the mean. The statistical analysis was performed by a log-rank test in a–g. The statistical data for lifespan can be found in Supplementary Table 1.
