
Fig. 1: Global fossil CO2 emissions.
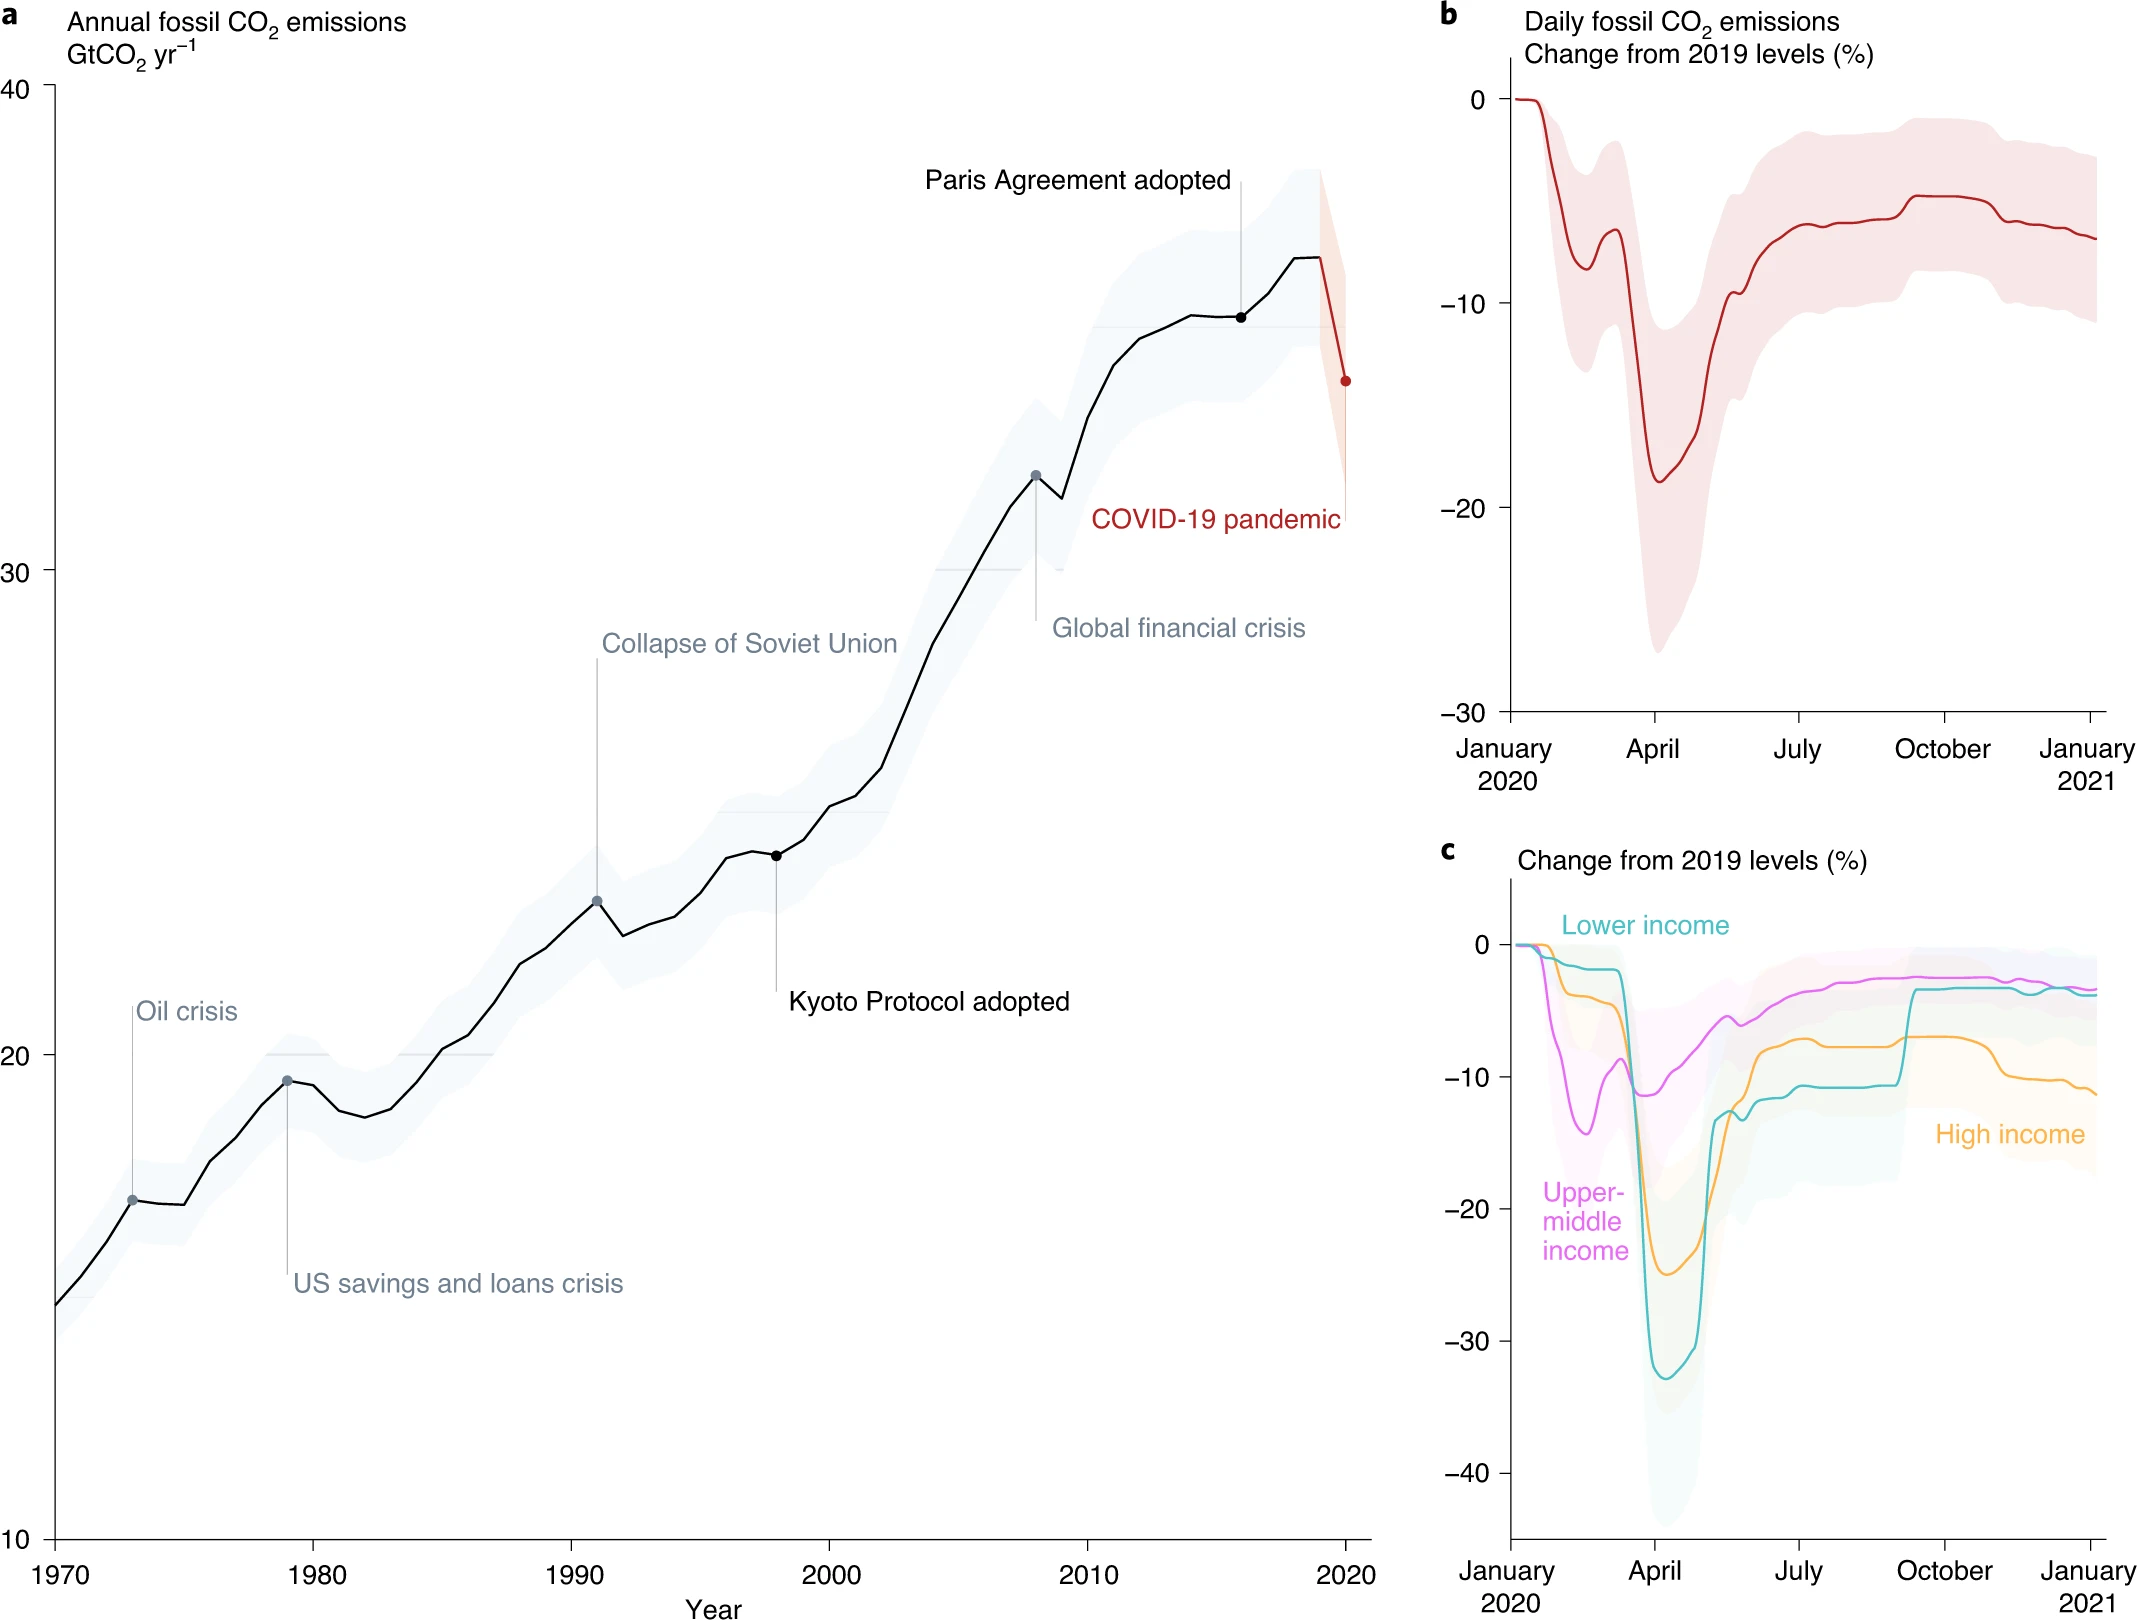
a, Annual emissions for 1970–2019 in GtCO2 yr−1, including a projection for 2020 (in red) on the basis of the analysis of the Global Carbon Project1 and their uncertainties (shading; Methods). b, Daily change in emissions in 2020 caused by COVID-19 restrictions, compared to a mean day in 2019, for the globe, updated from initial publication in May 2020 (ref. 3). c, As in b but for three economic income groups: the Annex B country group of mostly high-income economies with emissions targets under the Kyoto Protocol; upper-middle-income economies (including China) as defined by the World Bank; and lower-middle-income economies and low-income economies (including India) as a single group. Global economic and energy crises are highlighted in a, along with key international policy dates.
