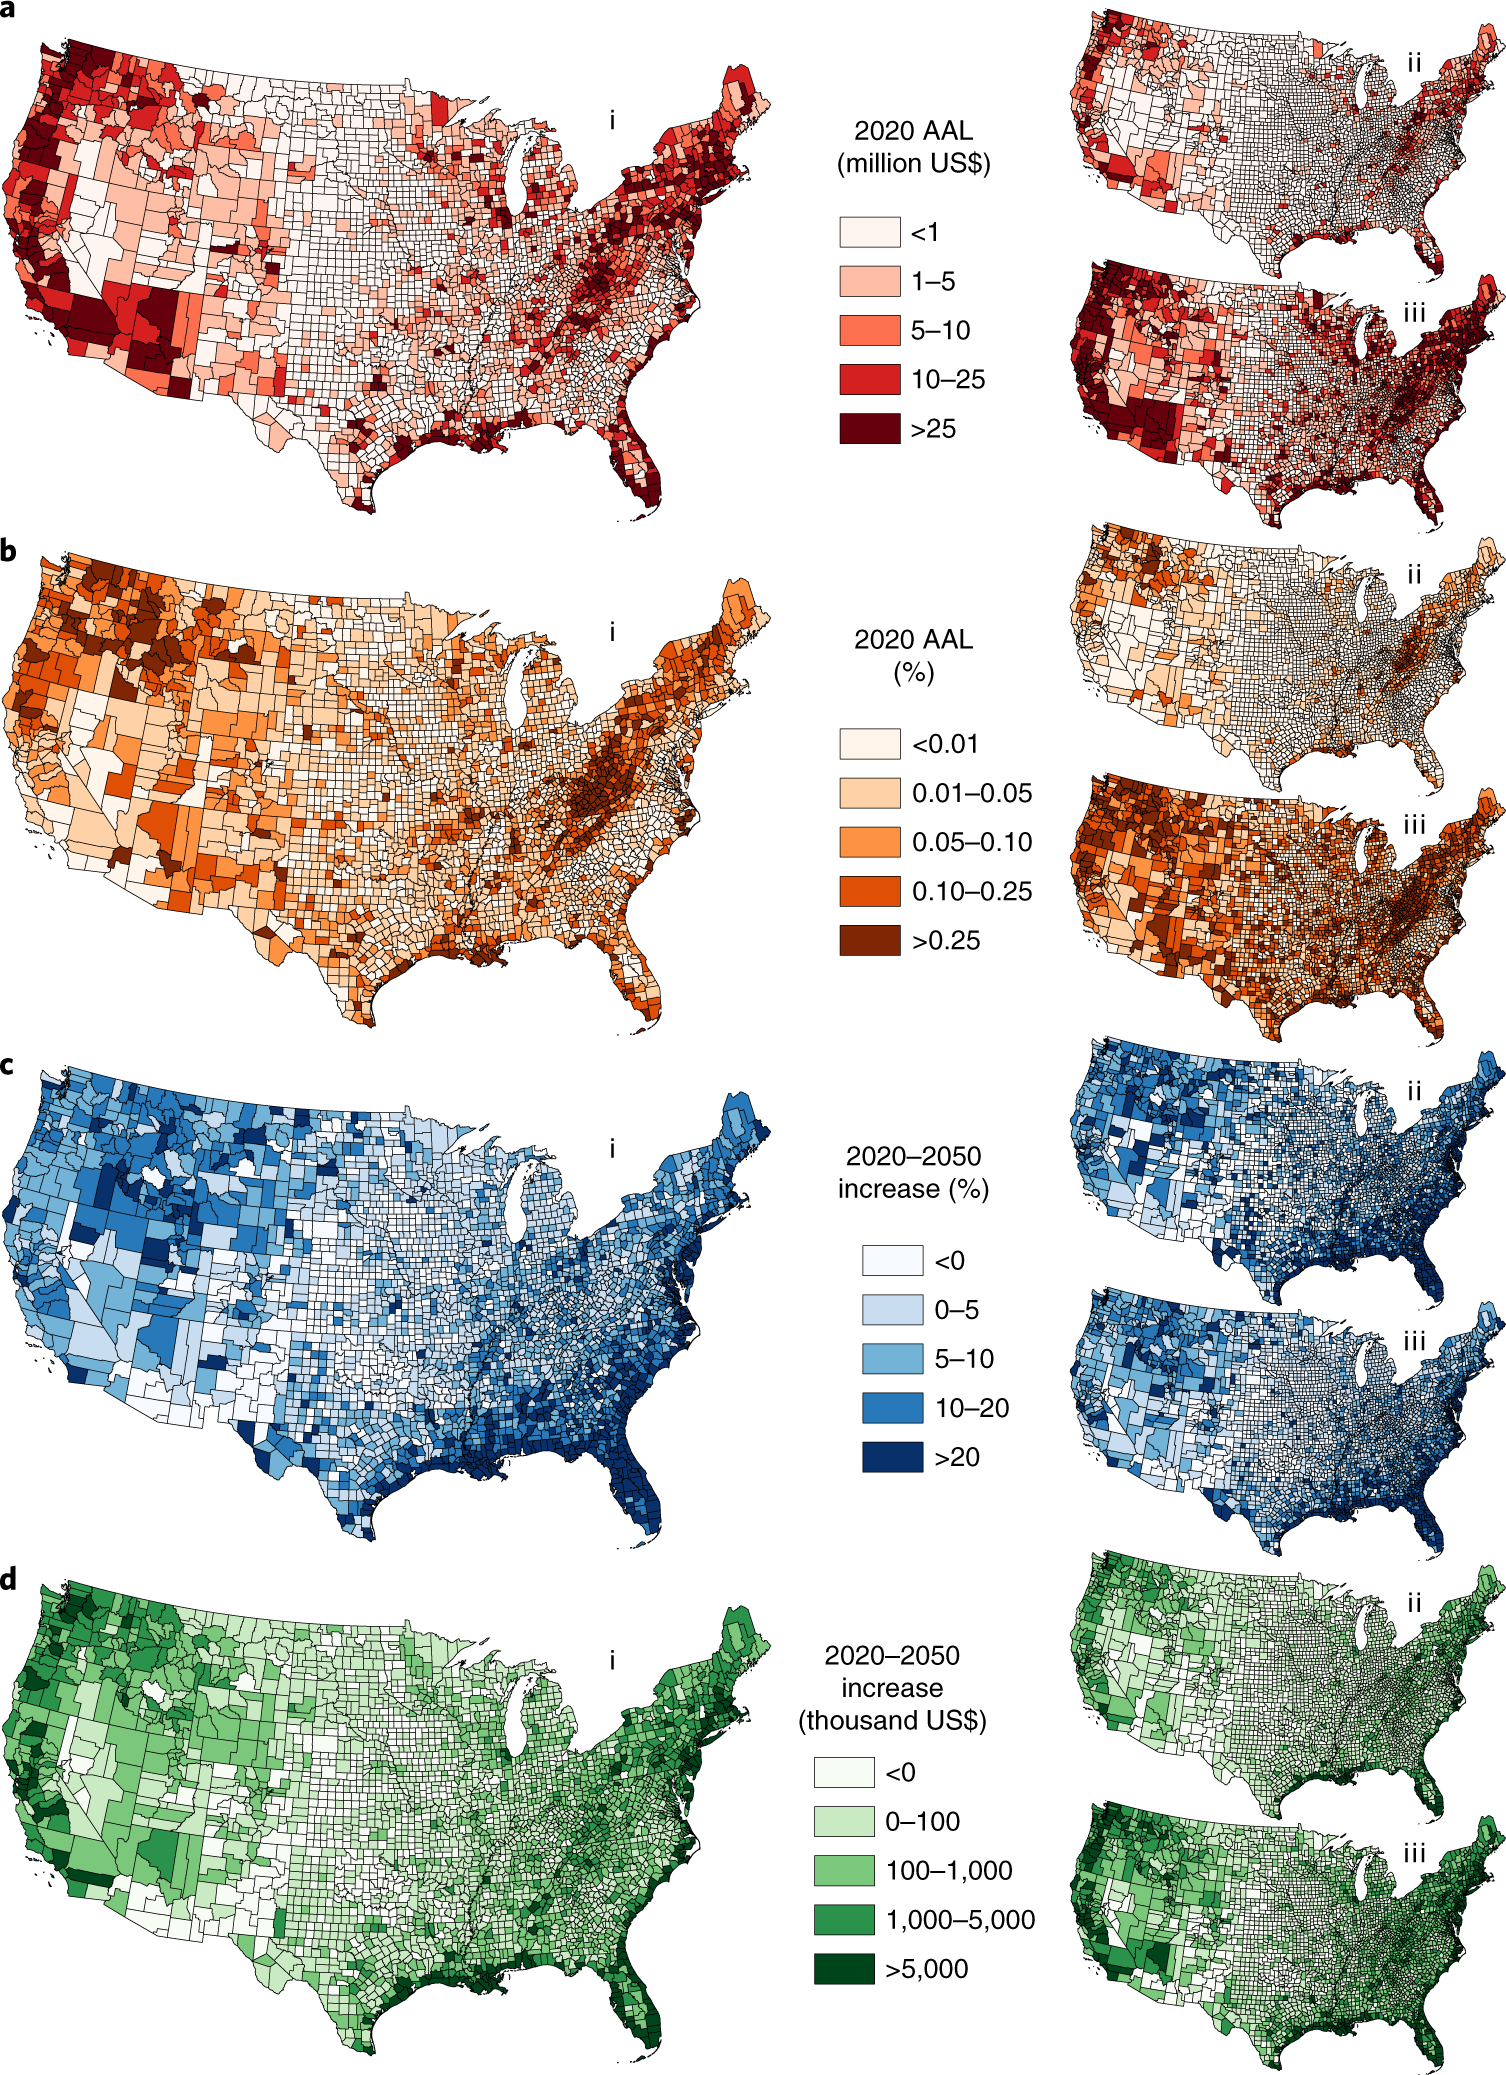
Fig. 1: Present and future US flood risk by county.
From: Inequitable patterns of US flood risk in the Anthropocene

a, Absolute AAL in 2020. b, Relative AAL in 2020. c, Relative AAL increase by 2050. d, Absolute AAL increase by 2050. In each panel, (i) represents the median county-level statistic, while (ii) and (iii) illustrate the bounds of the 95% confidence interval.
