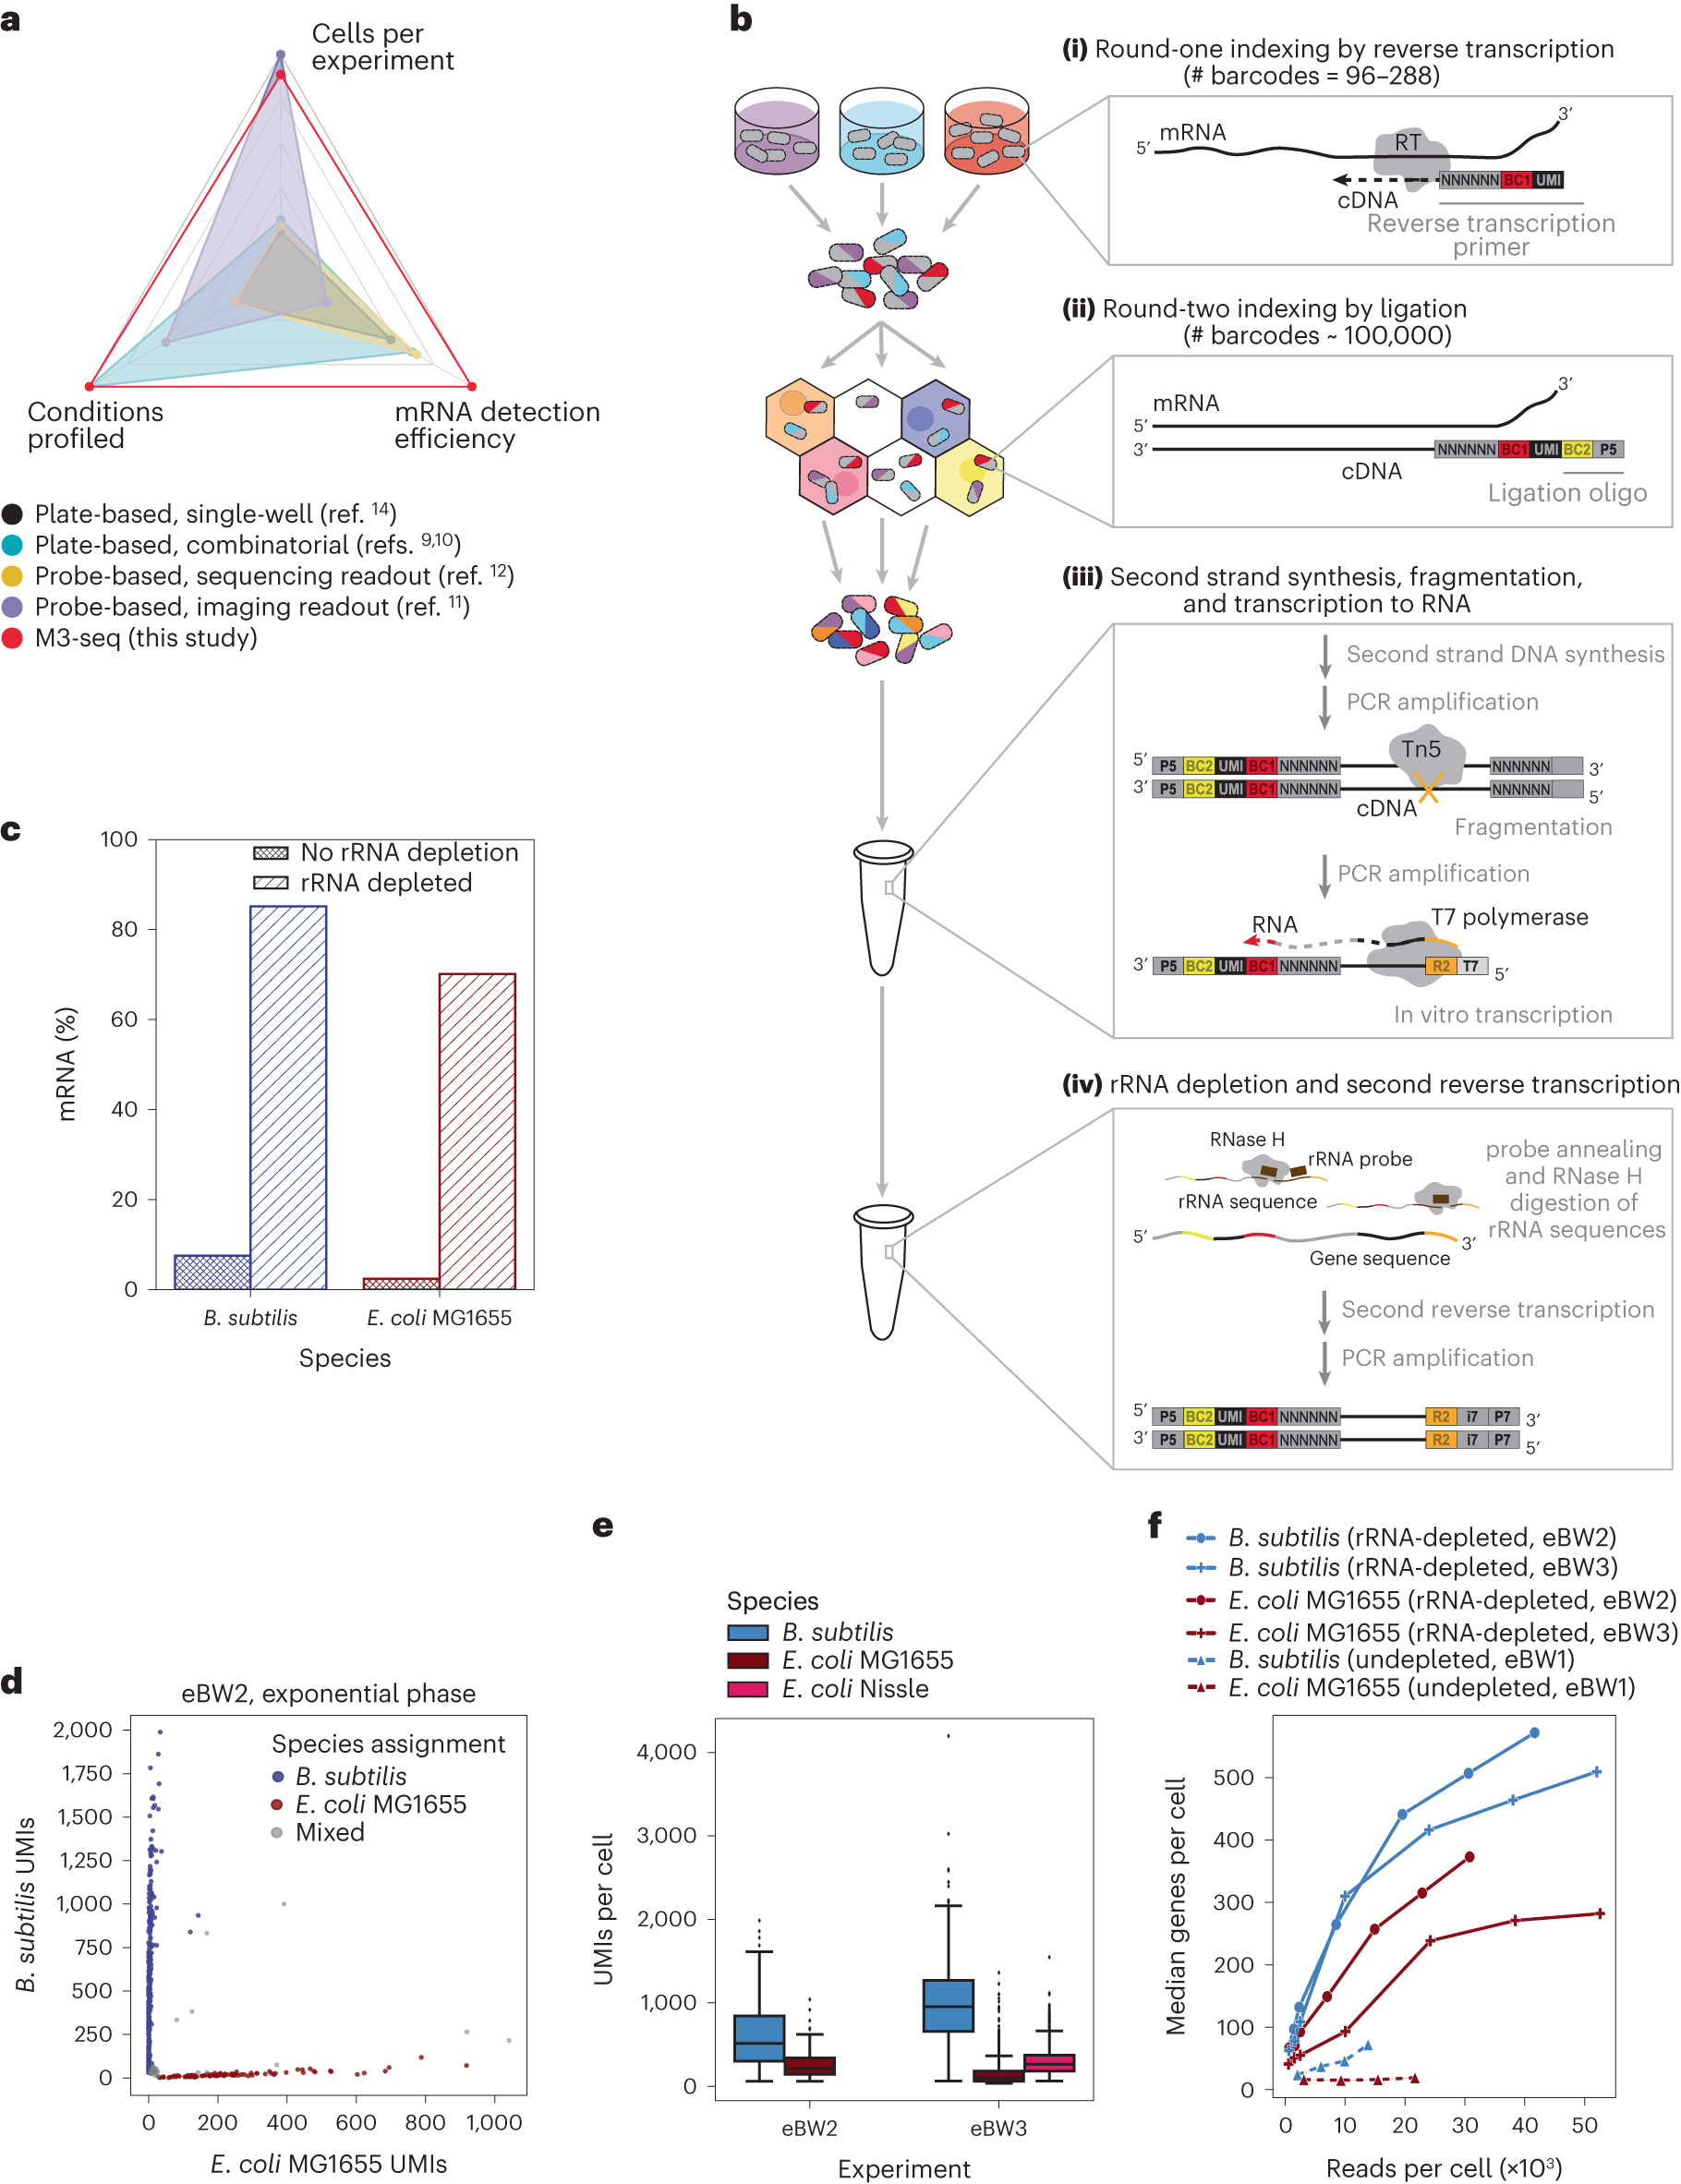
Fig. 1: Development of M3-seq platform for single-cell RNA-sequencing with post hoc rRNA depletion.

a, scRNA-seq methods previously established for bacteria with reported number of cells (ranging from 100 cells per experiment to 300,000 cells per experiment), conditions (ranging from 1 condition per experiment to 20 conditions per experiment) and mRNA genes per cell (ranging from 29 genes per cell to 371 genes per cell). Numbers in each category were selected by taking maximum reported values. Numbers also found in Extended Data Table 1. b, Schematic of M3-seq experimental workflow. Indexing: (i) RNA molecules are reverse transcribed in situ with indexed primers such that cells in each reaction (that is, separate plate wells) are marked with distinct sequences. Primers allow for random priming. (ii) Cells are then collected, mixed and distributed into droplets for a second round of indexing via ligation with barcoded oligos. Sequencing library preparation: Cells are collected again and lysed to release single-strand cDNAs. (iii) Second-strand synthesis is then performed in bulk reactions and resulting cDNA molecules are fragmented with Tn5 transposase, amplified via PCR to add a T7 promoter and converted to RNA using T7 RNA polymerase. (iv) To deplete ribosomal sequences, the amplified RNA library is hybridized to complementary DNA probes (Supplementary Table 3), and annealed sequences are cleaved by RNase H. Finally, remaining sequences are reverse transcribed back to DNA, sequencing adaptors are added and data are collected by sequencing. c, Percentages of mRNA sequences in B. subtilis and E. coli single-cell libraries prepared with and without rRNA depletion. Data from undepleted libraries come from eBW1 and data from depleted libraries come from eBW3. d, M3-seq analysis of a mixture of B. subtilis and E. coli wherein each point corresponds to a single ‘cell’ (that is, unique combination of plate and droplet barcodes). Species assignments were made as described in Methods. e, UMIs per cell (after species assignment) observed in exponential-phase cells across two experiments, eBW2 and eBW3 (515 ± 245 and 953 ± 310 median UMIs with absolute deviation for B. subtilis, respectively; 211 ± 85 and 100 ± 47 median UMIs with absolute deviation for E. coli MG1655, respectively; 266 ± 100 UMIs with for E. coli Nissle in eBW3). N = 1,336, 533, 84, 1,944, 1,659 cells, respectively. Boxplot limits are as defined in Methods. f, Median genes detected per B. subtilis or E. coli cell as a function of the number of total reads per cell across three experiments: eBW1, eBW2 and eBW3.
