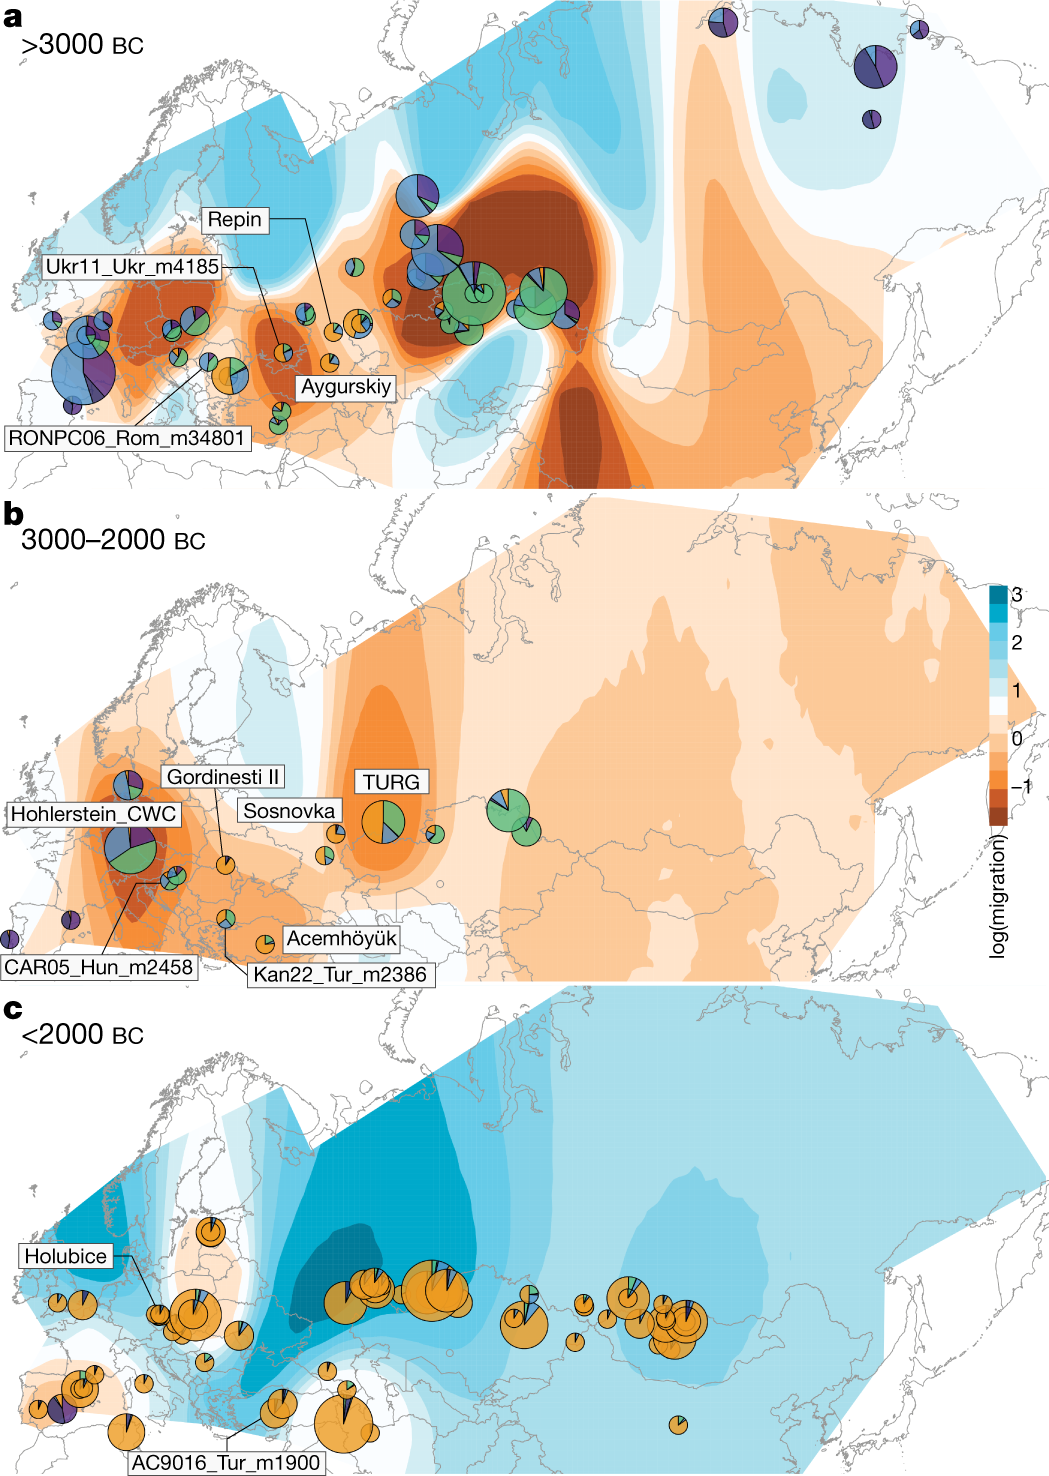
Fig. 2: Horse geographic and genetic affinities.
From: The origins and spread of domestic horses from the Western Eurasian steppes

a–c, EEMS-predicted migration barriers16 and average ancestry components found in each archaeological site from before 3000 bc (a), during the third millennium bc (b) and after around 2000 bc (c). The size of the pie charts is proportional to the number of samples analysed in a given location (<10, constant above). Pie chart colours refer to K = 6 ancestry components, averaged per location. Regions inferred as geographic barriers are shown in shades of brown, and regions affected by migrations are shown in shades of blue. The base map was obtained from rworldmap46.
